Publication
Metrics
AI Quick Summary
Researchers used ground-based infrared data to study Jupiter's atmospheric variability over 34 years, finding large temporal changes at the equator and smaller ones at mid-latitudes. The study suggests a possible connection between changes in the North and South Equatorial Belts.
Paper Preview
Abstract
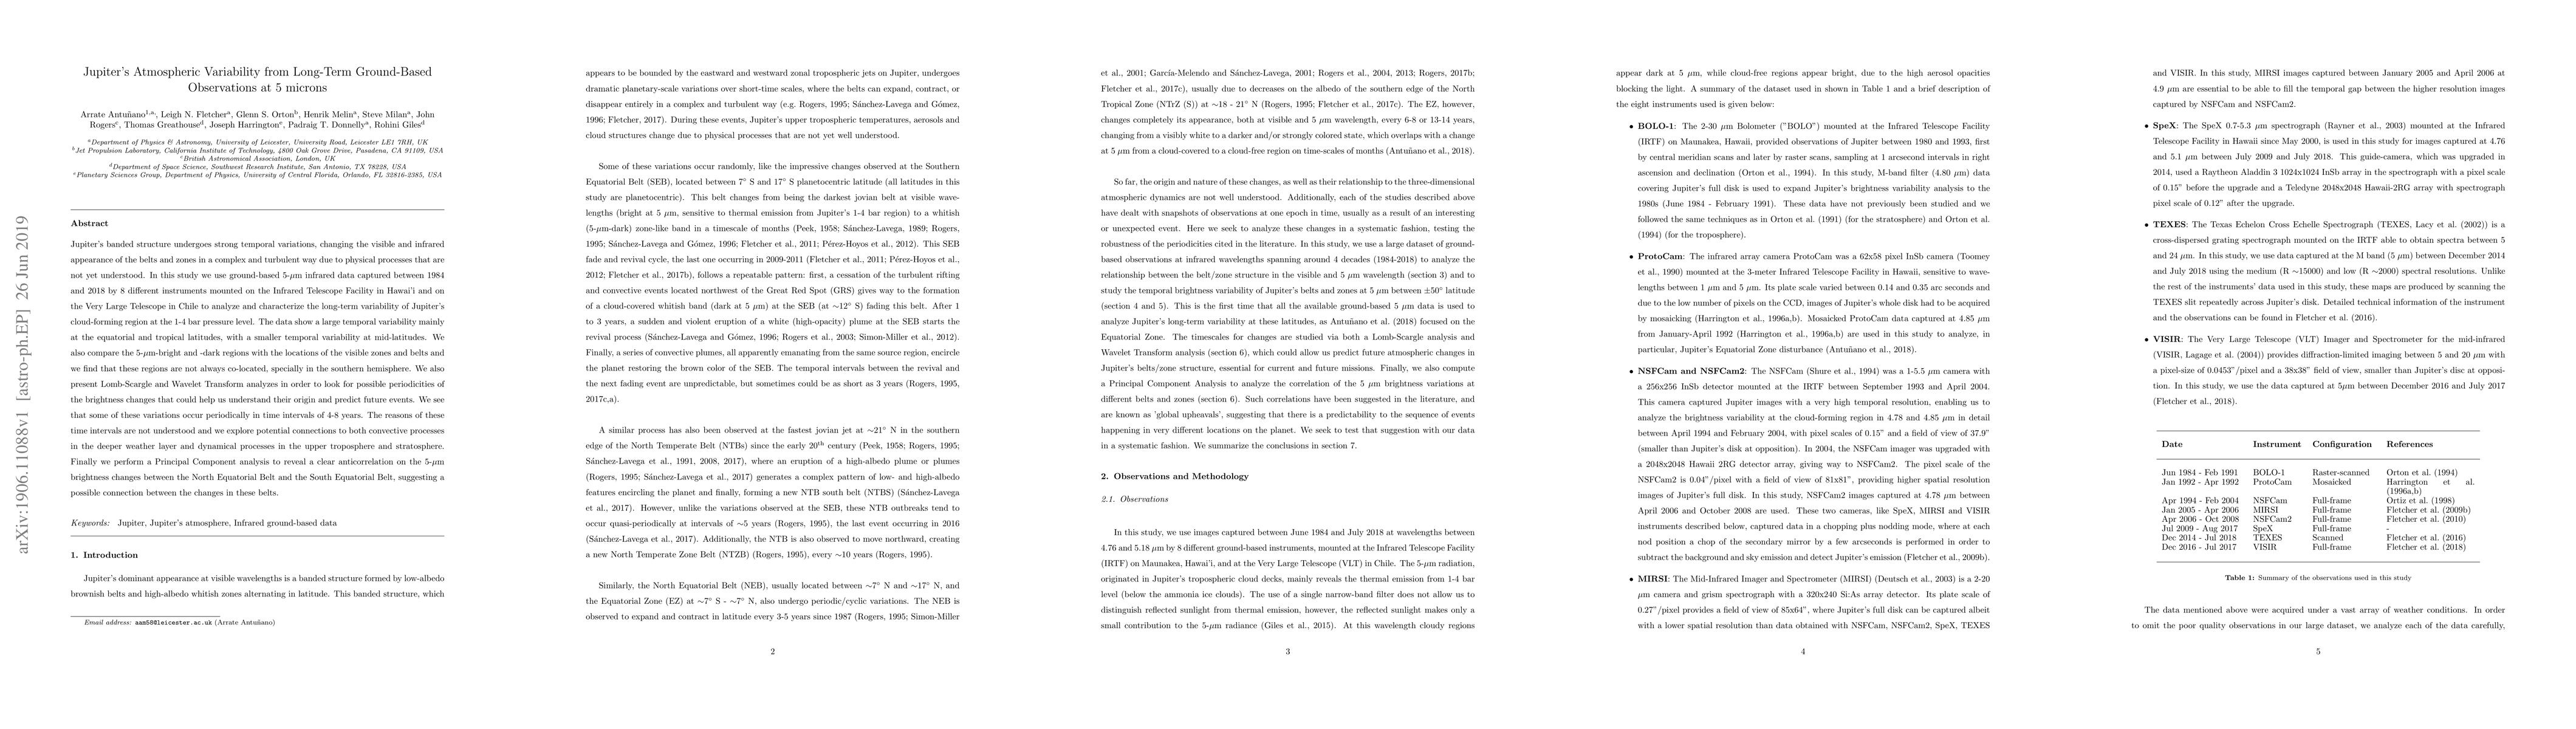
Jupiter's banded structure undergoes strong temporal variations, changing the visible and infrared appearance of the belts and zones in a complex and turbulent way due to physical processes that are not yet understood. In this study we use ground-based 5-$\mu$m infrared data captured between 1984 and 2018 by 8 different instruments mounted on the Infrared Telescope Facility in Hawai'i and on the Very Large Telescope in Chile to analyze and characterize the long-term variability of Jupiter's cloud-forming region at the 1-4 bar pressure level. The data show a large temporal variability mainly at the equatorial and tropical latitudes, with a smaller temporal variability at mid-latitudes. We also compare the 5-$\mu$m-bright and -dark regions with the locations of the visible zones and belts and we find that these regions are not always co-located, specially in the southern hemisphere. We also present Lomb-Scargle and Wavelet Transform analyzes in order to look for possible periodicities of the brightness changes that could help us understand their origin and predict future events. We see that some of these variations occur periodically in time intervals of 4-8 years. The reasons of these time intervals are not understood and we explore potential connections to both convective processes in the deeper weather layer and dynamical processes in the upper troposphere and stratosphere. Finally we perform a Principal Component analysis to reveal a clear anticorrelation on the 5-$\mu$m brightness changes between the North Equatorial Belt and the South Equatorial Belt, suggesting a possible connection between the changes in these belts.
AI Key Findings
Get AI-generated insights about this paper's methodology, results, significance, and more — seven facets brought into focus.
Impact
Paper Details
Authors
PDF Preview
Key Terms
Citation Network
Current paper (gray), citations (green), references (blue)
Display is limited for performance on very large graphs.
Discussion 0