Jupyter Scatter: Interactive Exploration of Large-Scale Datasets
Publication
Metrics
AI Quick Summary
Jupyter Scatter is an interactive widget for large-scale bivariate dataset exploration in Jupyter Notebooks, Colab, and VS Code, capable of rendering up to twenty million points with fast selection and integration with Pandas and Matplotlib.
Paper Preview
Abstract
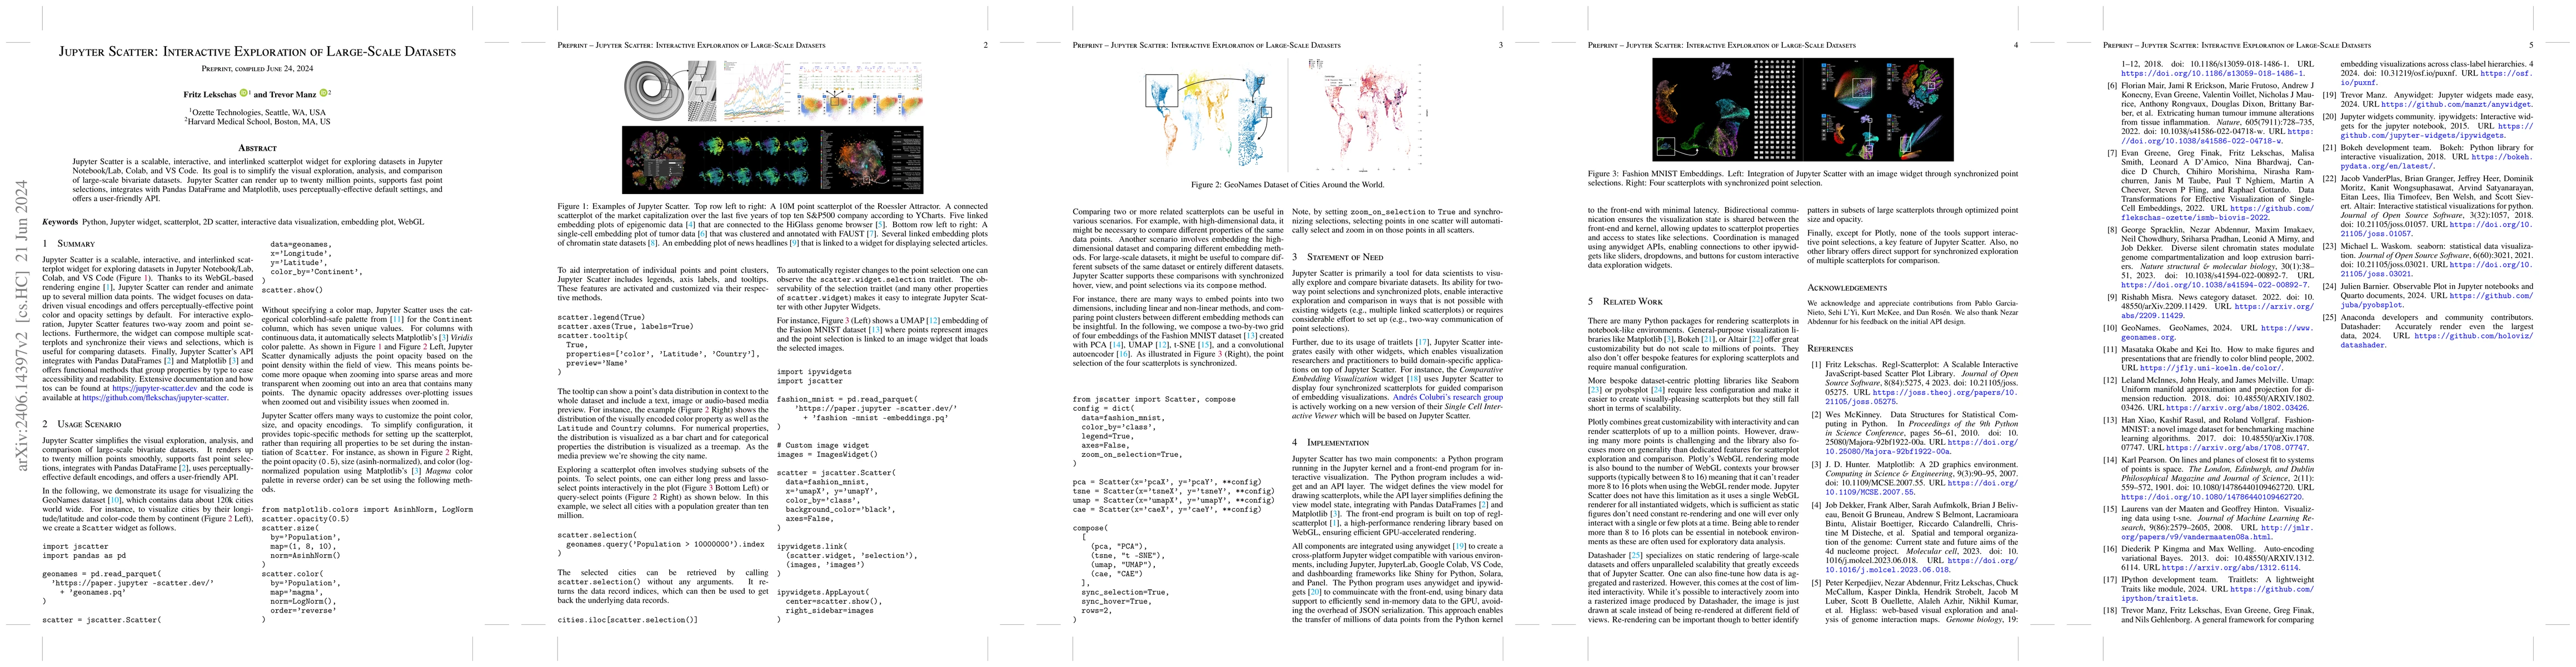
Jupyter Scatter is a scalable, interactive, and interlinked scatterplot widget for exploring datasets in Jupyter Notebook/Lab, Colab, and VS Code. Its goal is to simplify the visual exploration, analysis, and comparison of large-scale bivariate datasets. Jupyter Scatter can render up to twenty million points, supports fast point selections, integrates with Pandas DataFrame and Matplotlib, uses perceptually-effective default settings, and offers a user-friendly API.
AI Key Findings
Get AI-generated insights about this paper's methodology, results, significance, and more — seven facets brought into focus.
Impact
Paper Details
Authors
PDF Preview
Key Terms
Citation Network
Current paper (gray), citations (green), references (blue)
Display is limited for performance on very large graphs.
Discussion 0