Publication
Metrics
AI Quick Summary
This paper analyzes Kepler observations of M dwarfs, identifying magnetically active mid-M stars with frequent flares and starspots, and less active early-M stars with fewer flares. The study shows that M dwarfs exhibit a wide range of flare frequencies and energies, challenging the simple distinction between active and inactive stars based on H$\alpha$ emission.
Paper Preview
Abstract
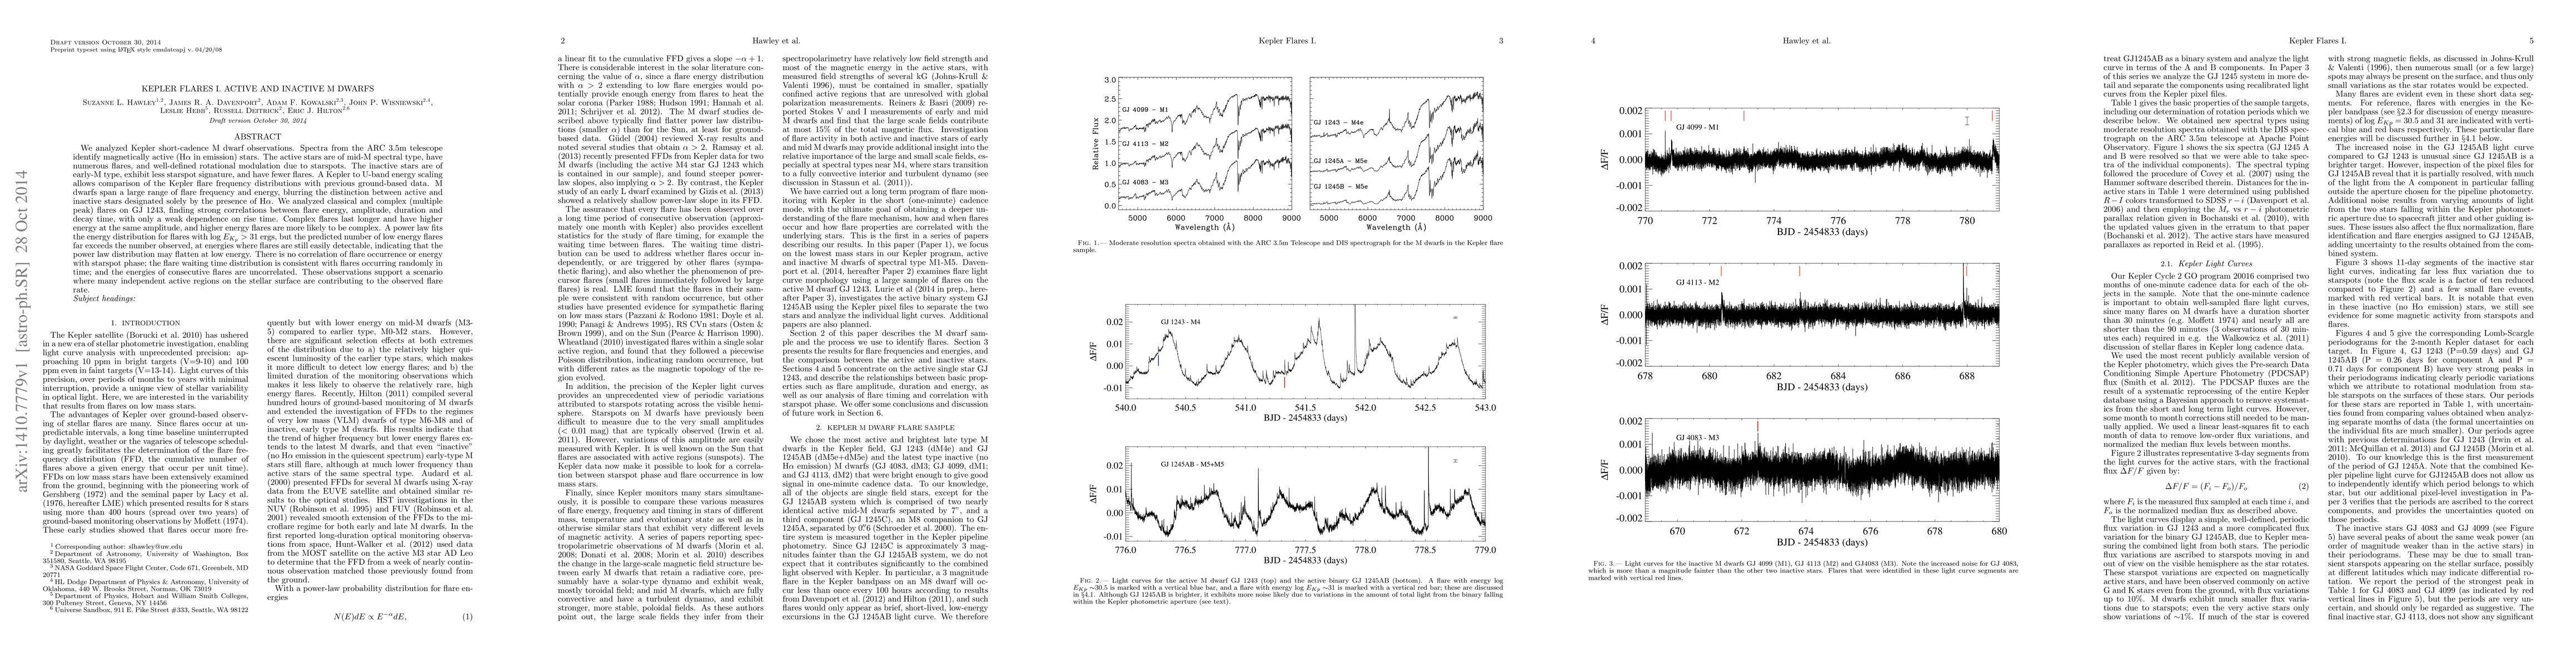
We analyzed Kepler short-cadence M dwarf observations. Spectra from the ARC 3.5m telescope identify magnetically active (H$\alpha$ in emission) stars. The active stars are of mid-M spectral type, have numerous flares, and well-defined rotational modulation due to starspots. The inactive stars are of early-M type, exhibit less starspot signature, and have fewer flares. A Kepler to U-band energy scaling allows comparison of the Kepler flare frequency distributions with previous ground-based data. M dwarfs span a large range of flare frequency and energy, blurring the distinction between active and inactive stars designated solely by the presence of H$\alpha$. We analyzed classical and complex (multiple peak) flares on GJ 1243, finding strong correlations between flare energy, amplitude, duration and decay time, with only a weak dependence on rise time. Complex flares last longer and have higher energy at the same amplitude, and higher energy flares are more likely to be complex. A power law fits the energy distribution for flares with log $E_{K_p} >$ 31 ergs, but the predicted number of low energy flares far exceeds the number observed, at energies where flares are still easily detectable, indicating that the power law distribution may flatten at low energy. There is no correlation of flare occurrence or energy with starspot phase; the flare waiting time distribution is consistent with flares occurring randomly in time; and the energies of consecutive flares are uncorrelated. These observations support a scenario where many independent active regions on the stellar surface are contributing to the observed flare rate.
AI Key Findings
Get AI-generated insights about this paper's methodology, results, significance, and more — seven facets brought into focus.
Impact
Paper Details
PDF Preview
Key Terms
Citation Network
Current paper (gray), citations (green), references (blue)
Display is limited for performance on very large graphs.
Discussion 0