Publication
Metrics
AI Quick Summary
The Herschel/PACS observations of L1448-MM, a Class 0 protostar, reveal distinct spatial distributions for various molecular emission lines. Low-energy transitions align with the outflow, while high-energy ones peak at the core. CO and H2O lines suggest warm and hot components, indicating shock-excitation, with water as the primary coolant. Non-LTE LVG calculations and C-shock models support this, though atomic emissions like [O I] and [Si II] suggest multiple shock events in the region.
Paper Preview
Abstract
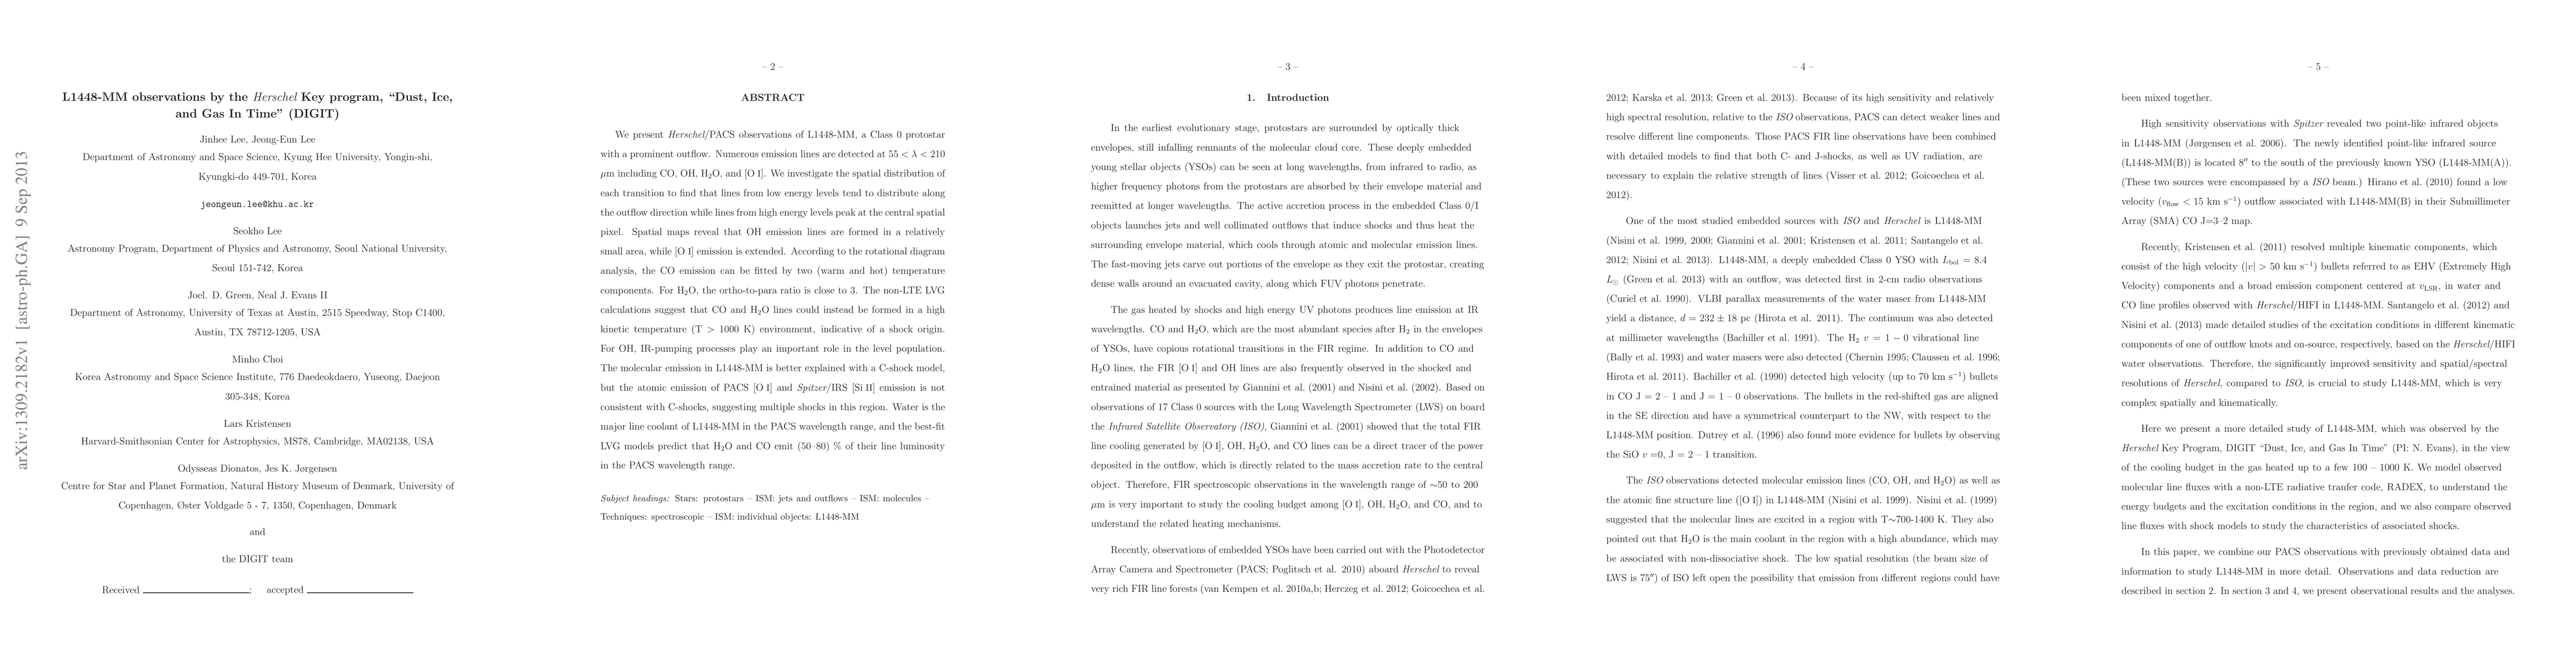
We present Herschel/PACS observations of L1448-MM, a Class 0 protostar with a prominent outflow. Numerous emission lines are detected at 55 < lambda < 210 micrometer including CO, OH, H2O, and [O I]. We investigate the spatial distribution of each transition to find that lines from low energy levels tend to distribute along the outflow direction while lines from high energy levels peak at the central spatial pixel. Spatial maps reveal that OH emission lines are formed in a relatively small area, while [O I] emission is extended. According to the rotational diagram analysis, the CO emission can be fitted by two (warm and hot) temperature components. For H2O, the ortho-to-para ratio is close to 3. The non-LTE LVG calculations suggest that CO and H2O lines could instead be formed in a high kinetic temperature (T > 1000 K) environment, indicative of a shock origin. For OH, IR-pumping processes play an important role in the level population. The molecular emission in L1448-MM is better explained with a C-shock model, but the atomic emission of PACS [O I] and Spitzer/IRS [Si II] emission is not consistent with C-shocks, suggesting multiple shocks in this region. Water is the major line coolant of L1448-MM in the PACS wavelength range, and the best-fit LVG models predict that H2O and CO emit (50-80)% of their line luminosity in the PACS wavelength range.
AI Key Findings
Get AI-generated insights about this paper's methodology, results, significance, and more — seven facets brought into focus.
Impact
Paper Details
PDF Preview
Key Terms
Citation Network
Current paper (gray), citations (green), references (blue)
Display is limited for performance on very large graphs.
Discussion 0