Summary
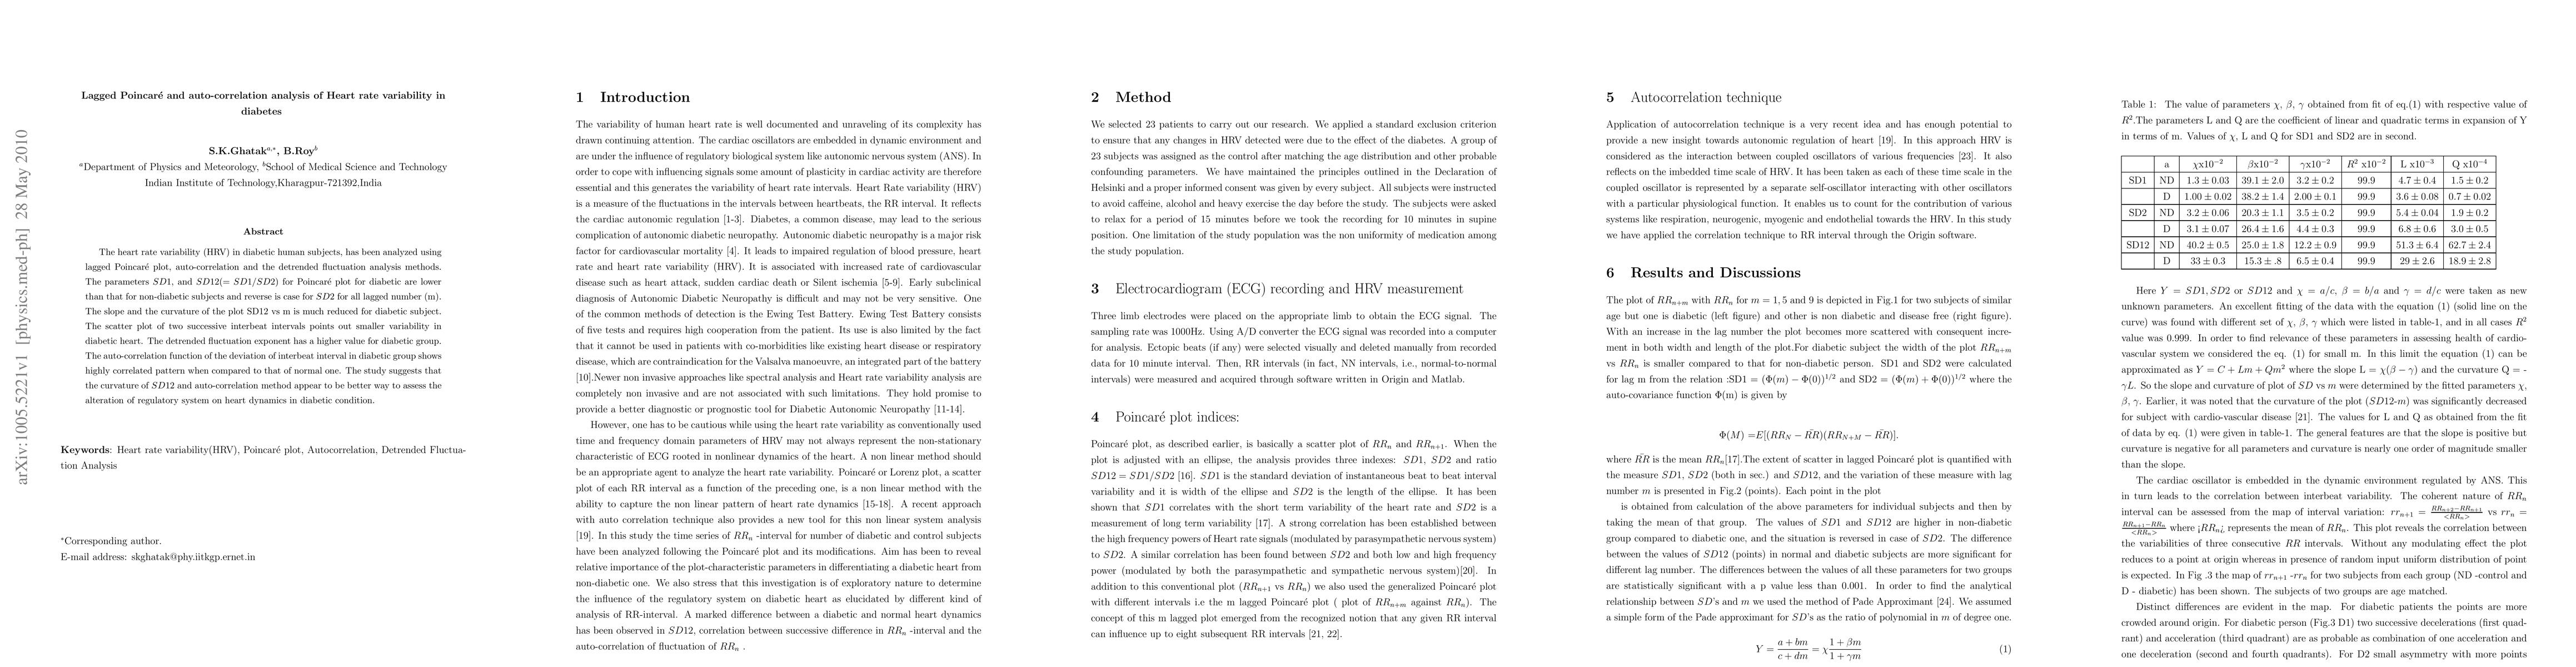
The heart rate variability (HRV) in diabetic human subjects, has been analyzed using lagged Poincar\'{e} plot, auto-correlation and the detrended fluctuation analysis methods. The parameters $SD1$, and $SD12 (= SD1/SD2)$ for Poincar\'{e} plot for diabetic are lower than that for non-diabetic subjects and reverse is case for $SD2$ for all lagged number (m). The slope and the curvature of the plot SD12 vs m is much reduced for diabetic subject. The scatter plot of two successive interbeat intervals points out smaller variability in diabetic heart. The detrended fluctuation exponent has a higher value for diabetic group. The auto-correlation function of the deviation of interbeat interval in diabetic group shows highly correlated pattern when compared to that of normal one. The study suggests that the curvature of $SD12$ and auto-correlation method appear to be better way to assess the alteration of regulatory system on heart dynamics in diabetic condition.
AI Key Findings
Get AI-generated insights about this paper's methodology, results, and significance.
Paper Details
PDF Preview
Key Terms
Citation Network
Current paper (gray), citations (green), references (blue)
Display is limited for performance on very large graphs.
Similar Papers
Found 4 papersNo citations found for this paper.
Comments (0)