Publication
Metrics
AI Quick Summary
This paper examines the large scale bias in dark matter halos using the peak-background split argument, finding discrepancies between different bias measurements. It concludes that deterministic nonlinear local bias models cannot fully explain the observed differences, suggesting a need for more sophisticated nonlocal bias models.
Paper Preview
Abstract
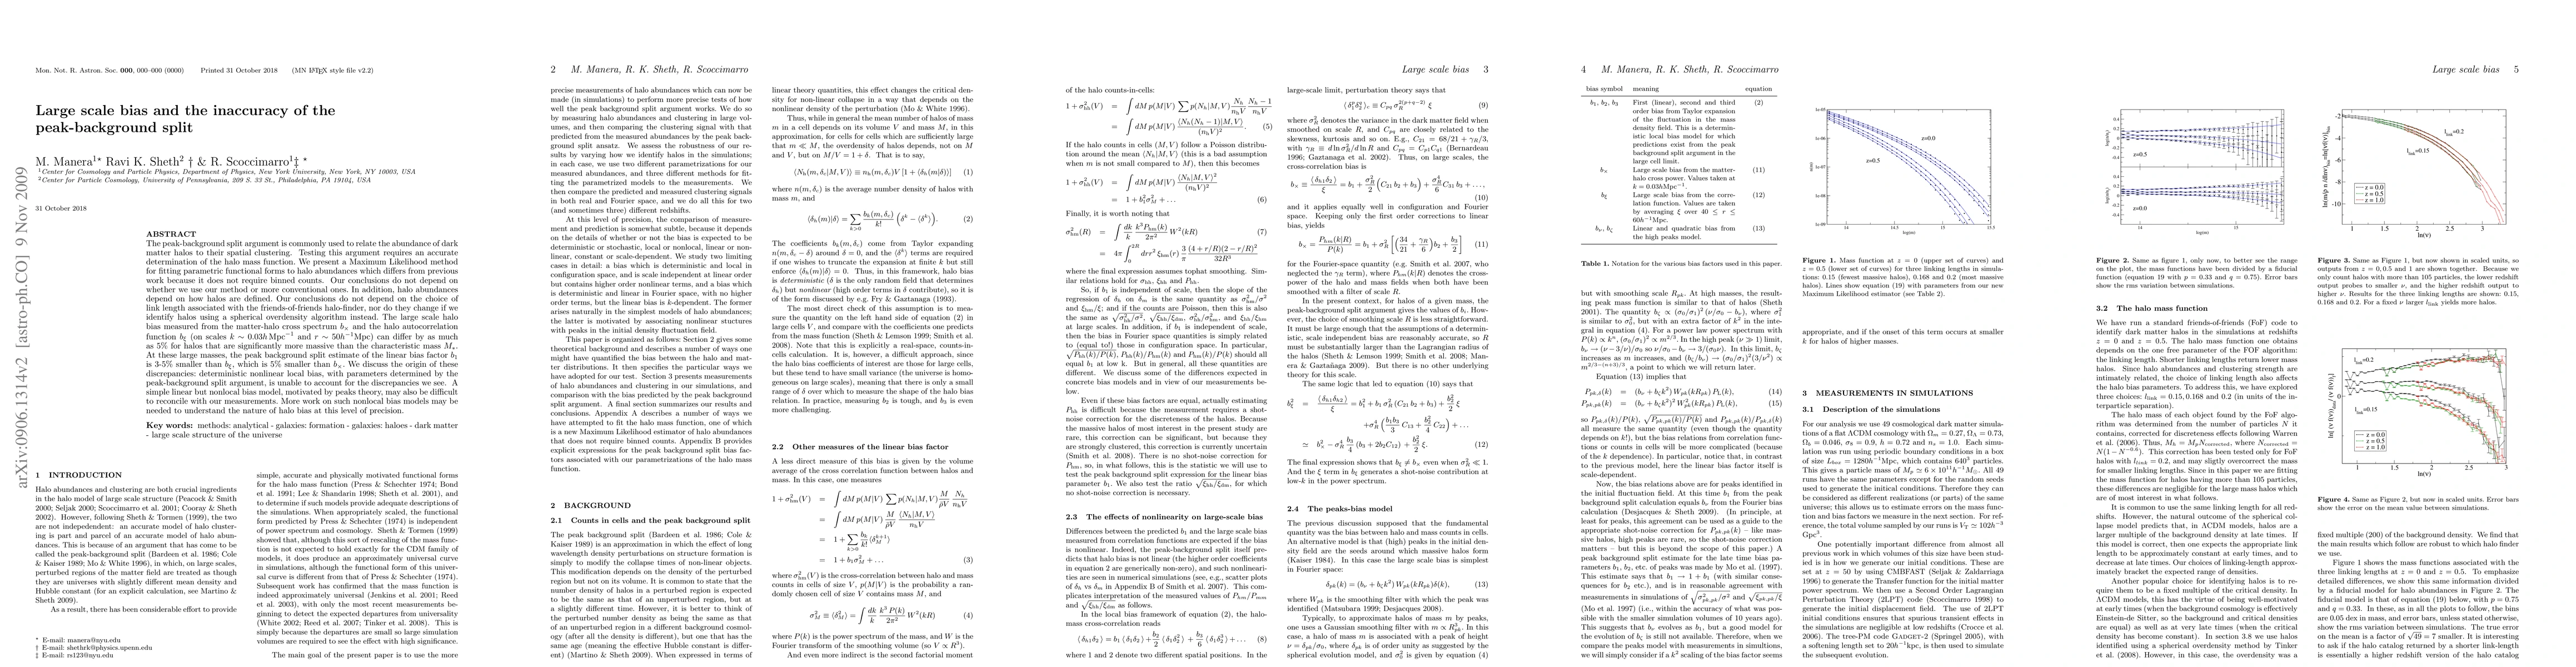
The peak-background split argument is commonly used to relate the abundance of dark matter halos to their spatial clustering. Testing this argument requires an accurate determination of the halo mass function. We present a Maximum Likelihood method for fitting parametric functional forms to halo abundances which differs from previous work because it does not require binned counts. Our conclusions do not depend on whether we use our method or more conventional ones. In addition, halo abundances depend on how halos are defined. Our conclusions do not depend on the choice of link length associated with the friends-of-friends halo-finder, nor do they change if we identify halos using a spherical overdensity algorithm instead. The large scale halo bias measured from the matter-halo cross spectrum b_x and the halo autocorrelation function b_xi (on scales k~0.03h/Mpc and r ~50 Mpc/h) can differ by as much as 5% for halos that are significantly more massive than the characteristic mass M*. At these large masses, the peak background split estimate of the linear bias factor b1 is 3-5% smaller than b_xi, which is 5% smaller than b_x. We discuss the origin of these discrepancies: deterministic nonlinear local bias, with parameters determined by the peak-background split argument, is unable to account for the discrepancies we see. A simple linear but nonlocal bias model, motivated by peaks theory, may also be difficult to reconcile with our measurements. More work on such nonlocal bias models may be needed to understand the nature of halo bias at this level of precision.
AI Key Findings
Get AI-generated insights about this paper's methodology, results, significance, and more — seven facets brought into focus.
Impact
Paper Details
PDF Preview
Key Terms
Citation Network
Current paper (gray), citations (green), references (blue)
Display is limited for performance on very large graphs.
Discussion 0