Publication
Metrics
AI Quick Summary
The paper introduces encube, a comprehensive system for comparative visualisation of multidimensional data, integrating qualitative and quantitative analysis in both immersive and desktop environments. The system supports collaborative discovery processes and is adaptable for various research scenarios, demonstrated through its use in a hybrid visualisation environment.
Paper Preview
Abstract
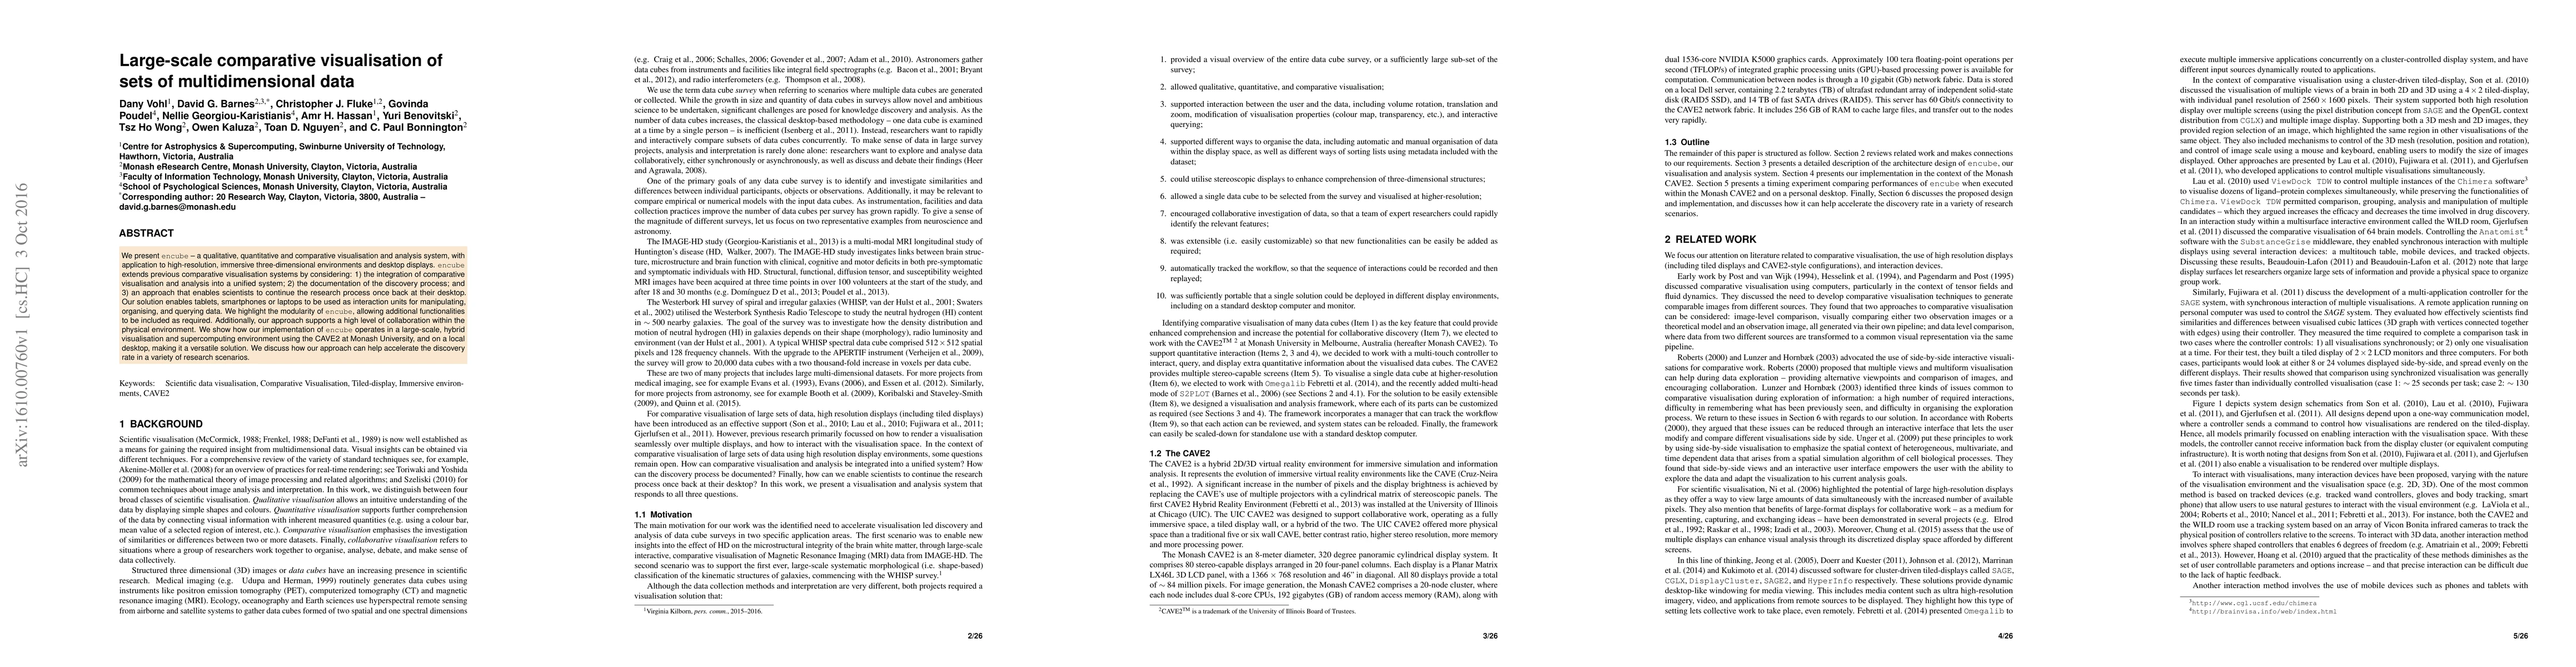
We present encube $-$ a qualitative, quantitative and comparative visualisation and analysis system, with application to high-resolution, immersive three-dimensional environments and desktop displays. encube extends previous comparative visualisation systems by considering: 1) the integration of comparative visualisation and analysis into a unified system; 2) the documentation of the discovery process; and 3) an approach that enables scientists to continue the research process once back at their desktop. Our solution enables tablets, smartphones or laptops to be used as interaction units for manipulating, organising, and querying data. We highlight the modularity of encube, allowing additional functionalities to be included as required. Additionally, our approach supports a high level of collaboration within the physical environment. We show how our implementation of encube operates in a large-scale, hybrid visualisation and supercomputing environment using the CAVE2 at Monash University, and on a local desktop, making it a versatile solution. We discuss how our approach can help accelerate the discovery rate in a variety of research scenarios.
AI Key Findings
Get AI-generated insights about this paper's methodology, results, significance, and more — seven facets brought into focus.
Impact
Paper Details
PDF Preview
Key Terms
Citation Network
Current paper (gray), citations (green), references (blue)
Display is limited for performance on very large graphs.
Discussion 0