Latent function-on-scalar regression models for observed sequences of binary data: a restricted likelihood approach
Publication
Metrics
AI Quick Summary
This paper introduces a novel latent function-on-scalar regression model for analyzing observed sequences of binary data, proposing a restricted likelihood approach that leverages a complete data likelihood for handling non-equally spaced and missing data. The method employs an adaptive MCEM algorithm for smooth estimations without the need for smoothing parameter selection, and is demonstrated through simulations and a real case study, implemented in the R package dfrr.
Paper Preview
Abstract
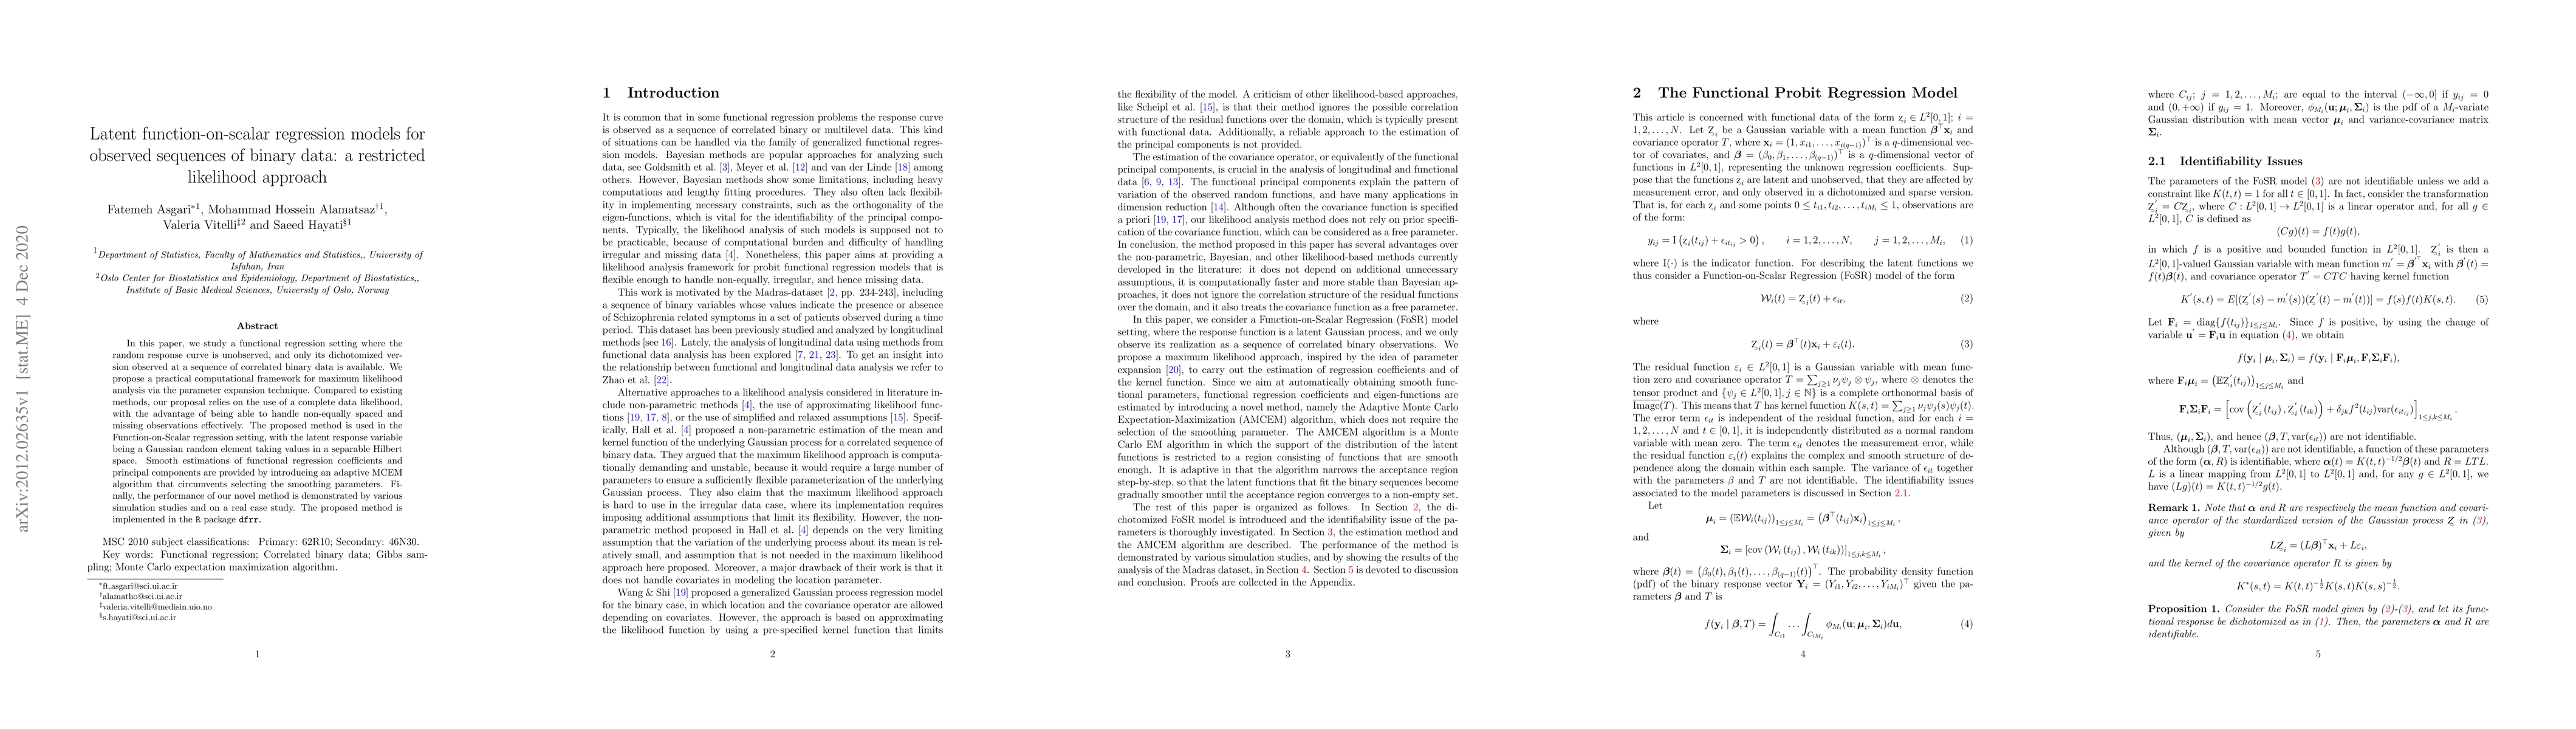
In this paper, we study a functional regression setting where the random response curve is unobserved, and only its dichotomized version observed at a sequence of correlated binary data is available. We propose a practical computational framework for maximum likelihood analysis via the parameter expansion technique. Compared to existing methods, our proposal relies on the use of a complete data likelihood, with the advantage of being able to handle non-equally spaced and missing observations effectively. The proposed method is used in the Function-on-Scalar regression setting, with the latent response variable being a Gaussian random element taking values in a separable Hilbert space. Smooth estimations of functional regression coefficients and principal components are provided by introducing an adaptive MCEM algorithm that circumvents selecting the smoothing parameters. Finally, the performance of our novel method is demonstrated by various simulation studies and on a real case study. The proposed method is implemented in the R package dfrr.
AI Key Findings
Get AI-generated insights about this paper's methodology, results, significance, and more — seven facets brought into focus.
Impact
Paper Details
Authors
PDF Preview
Key Terms
Citation Network
Current paper (gray), citations (green), references (blue)
Display is limited for performance on very large graphs.
Discussion 0