LCD-Net: A Lightweight Remote Sensing Change Detection Network Combining Feature Fusion and Gating Mechanism
Publication
Metrics
AI Quick Summary
LCD-Net is a lightweight remote sensing change detection network designed to efficiently detect changes in bitemporal images with minimal computational overhead. It utilizes MobileNetV2, a Temporal Interaction and Fusion Module, and a Feature Fusion Module to enhance temporal context and multiscale feature extraction, while a Gated Mechanism Module dynamically adjusts channel weights for improved detection accuracy.
Paper Preview
Abstract
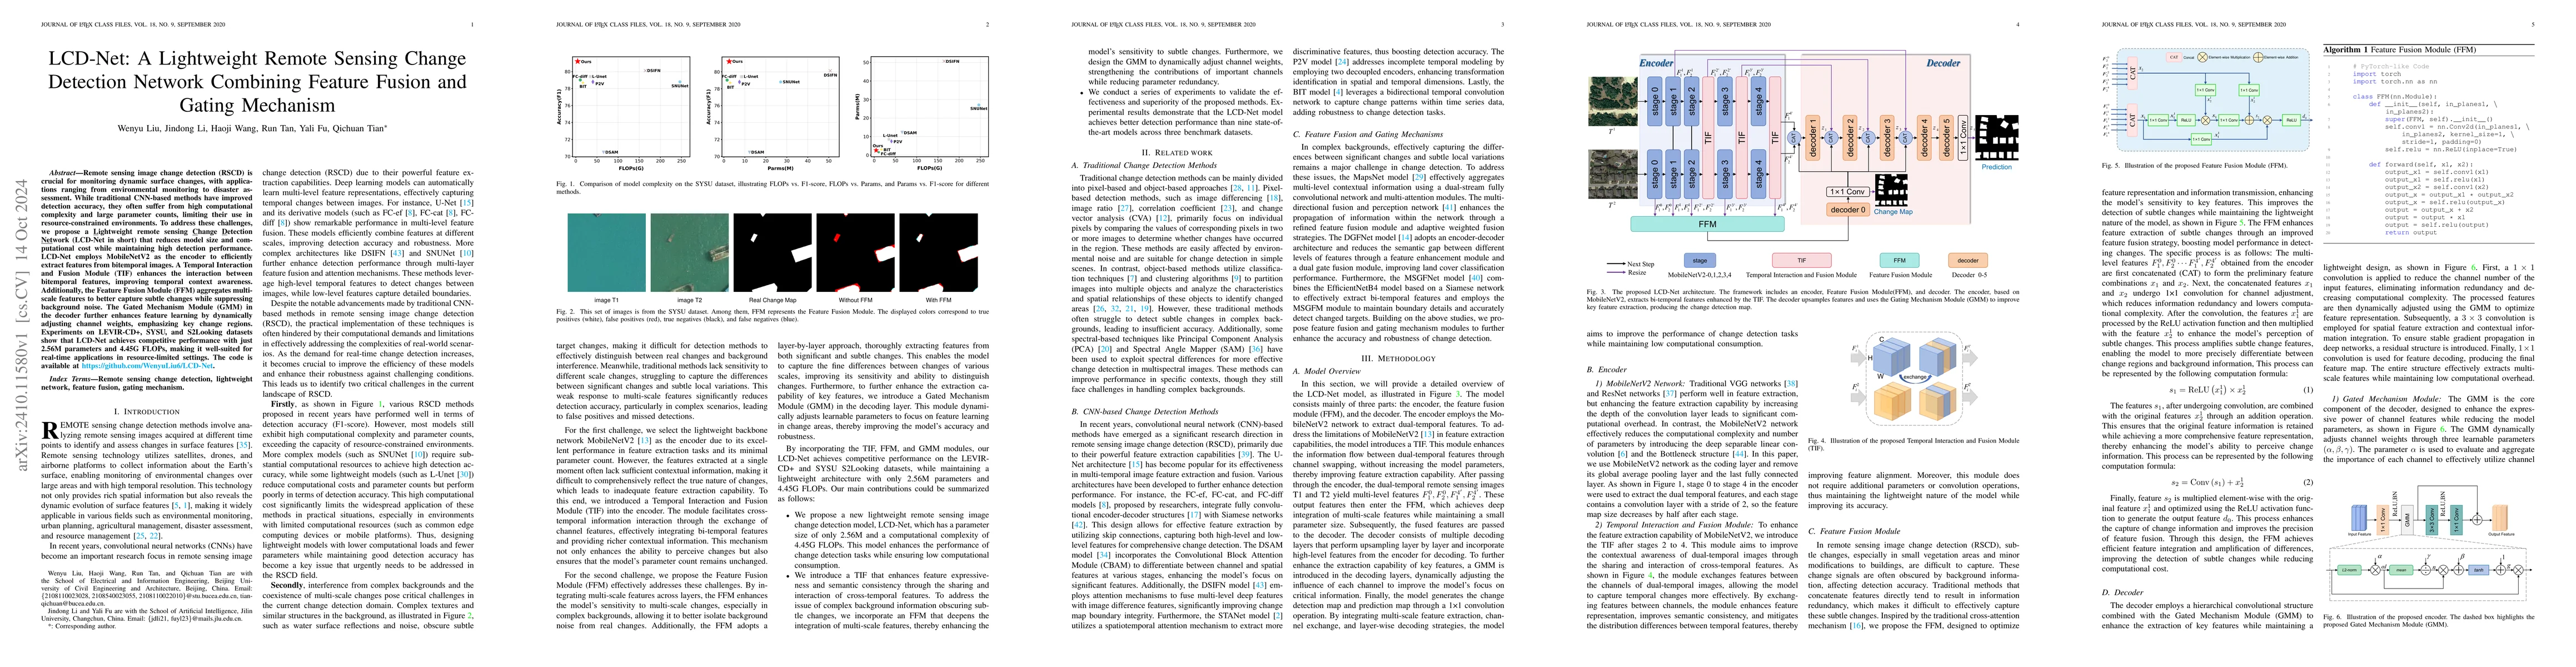
Remote sensing image change detection (RSCD) is crucial for monitoring dynamic surface changes, with applications ranging from environmental monitoring to disaster assessment. While traditional CNN-based methods have improved detection accuracy, they often suffer from high computational complexity and large parameter counts, limiting their use in resource-constrained environments. To address these challenges, we propose a Lightweight remote sensing Change Detection Network (LCD-Net in short) that reduces model size and computational cost while maintaining high detection performance. LCD-Net employs MobileNetV2 as the encoder to efficiently extract features from bitemporal images. A Temporal Interaction and Fusion Module (TIF) enhances the interaction between bitemporal features, improving temporal context awareness. Additionally, the Feature Fusion Module (FFM) aggregates multiscale features to better capture subtle changes while suppressing background noise. The Gated Mechanism Module (GMM) in the decoder further enhances feature learning by dynamically adjusting channel weights, emphasizing key change regions. Experiments on LEVIR-CD+, SYSU, and S2Looking datasets show that LCD-Net achieves competitive performance with just 2.56M parameters and 4.45G FLOPs, making it well-suited for real-time applications in resource-limited settings. The code is available at https://github.com/WenyuLiu6/LCD-Net.
AI Key Findings
Get AI-generated insights about this paper's methodology, results, significance, and more — seven facets brought into focus.
Impact
Authors
PDF Preview
Citation Network
Current paper (gray), citations (green), references (blue)
Display is limited for performance on very large graphs.
Discussion 0