Publication
Metrics
AI Quick Summary
This paper analyzes the impact of data structure on the generalization performance of SGD, demonstrating that a simplified Gaussian model can accurately predict test loss for complex neural networks. The study finds that optimal batch sizes for fixed compute budgets are often small and depend on feature correlation, highlighting computational benefits of small batch sizes.
Paper Preview
Abstract
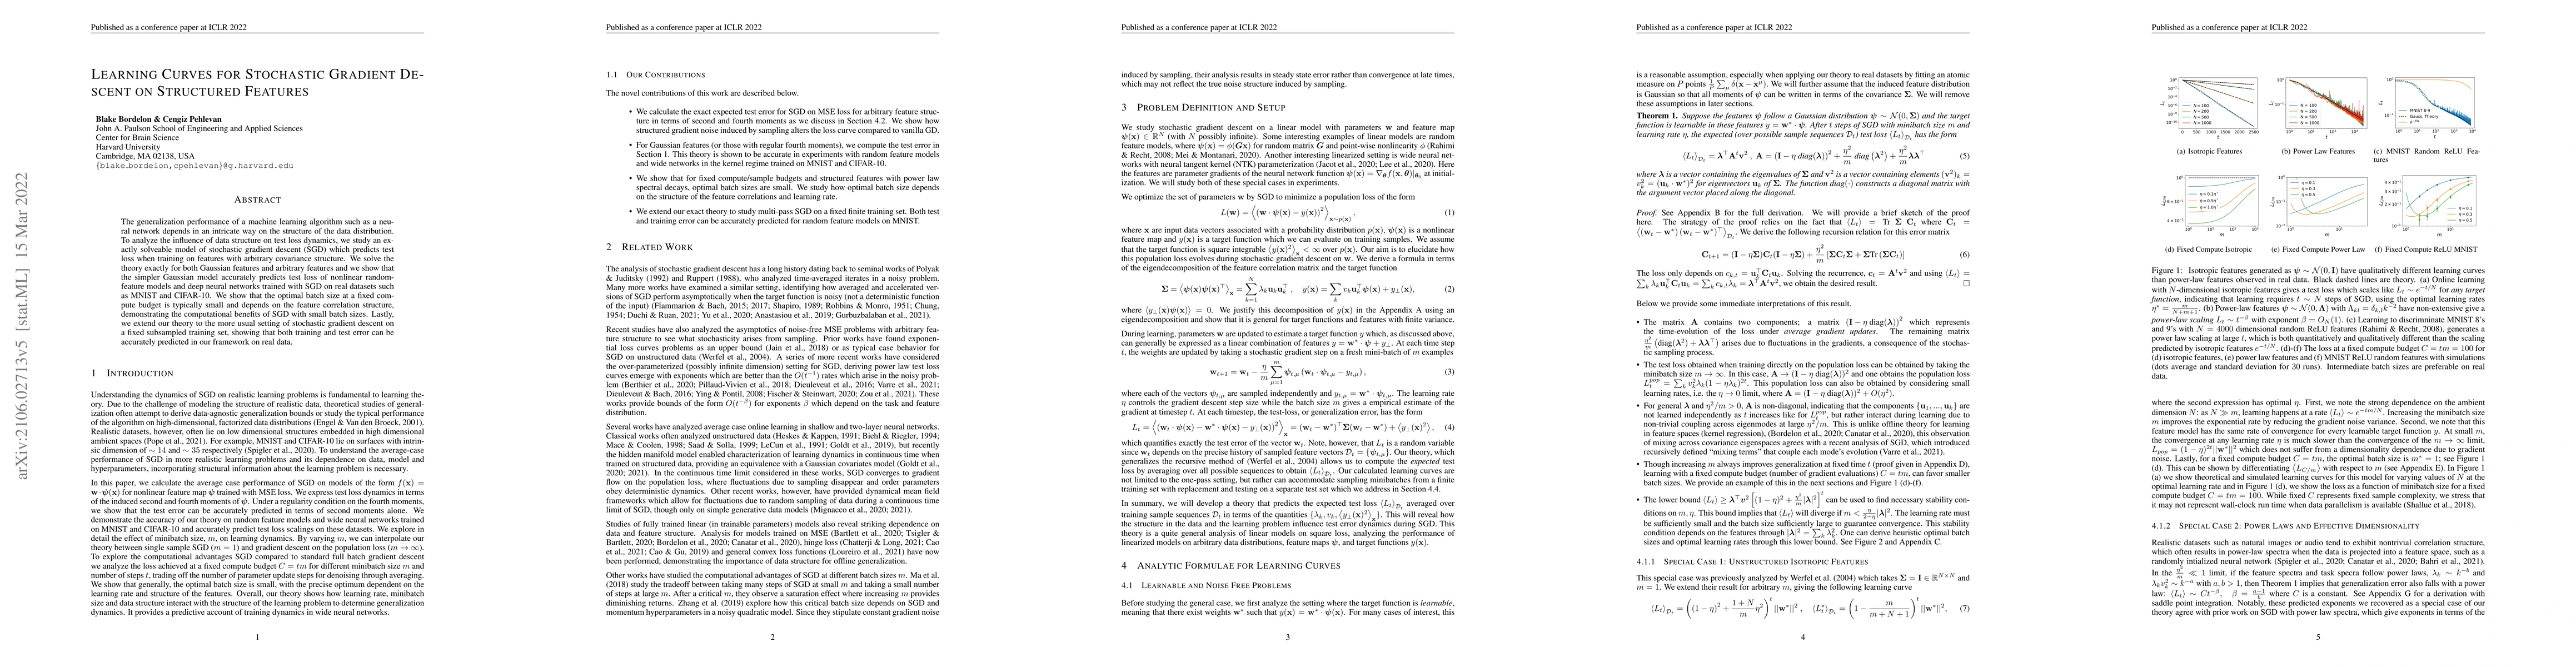
The generalization performance of a machine learning algorithm such as a neural network depends in a non-trivial way on the structure of the data distribution. To analyze the influence of data structure on test loss dynamics, we study an exactly solveable model of stochastic gradient descent (SGD) on mean square loss which predicts test loss when training on features with arbitrary covariance structure. We solve the theory exactly for both Gaussian features and arbitrary features and we show that the simpler Gaussian model accurately predicts test loss of nonlinear random-feature models and deep neural networks trained with SGD on real datasets such as MNIST and CIFAR-10. We show that the optimal batch size at a fixed compute budget is typically small and depends on the feature correlation structure, demonstrating the computational benefits of SGD with small batch sizes. Lastly, we extend our theory to the more usual setting of stochastic gradient descent on a fixed subsampled training set, showing that both training and test error can be accurately predicted in our framework on real data.
AI Key Findings
Get AI-generated insights about this paper's methodology, results, significance, and more — seven facets brought into focus.
Impact
Paper Details
Authors
PDF Preview
Key Terms
Citation Network
Current paper (gray), citations (green), references (blue)
Display is limited for performance on very large graphs.
Discussion 0