Publication
Metrics
Paper Preview
Abstract
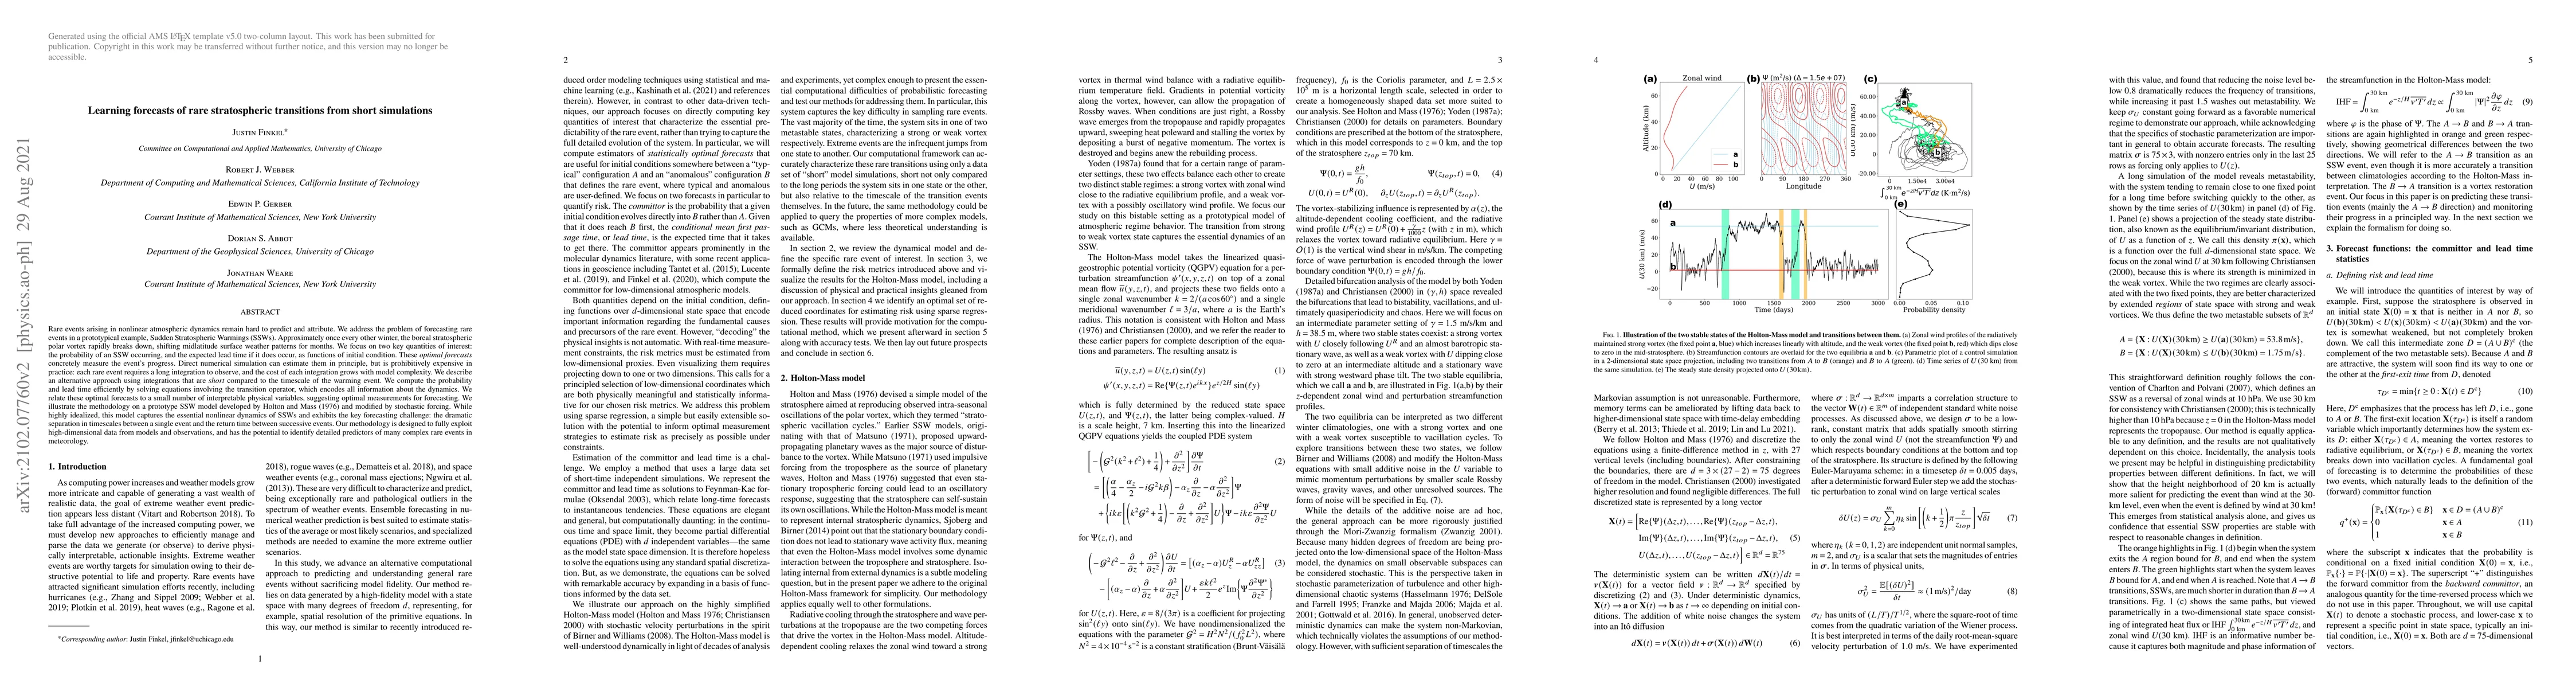
Rare events arising in nonlinear atmospheric dynamics remain hard to predict and attribute. We address the problem of forecasting rare events in a prototypical example, Sudden Stratospheric Warmings (SSWs). Approximately once every other winter, the boreal stratospheric polar vortex rapidly breaks down, shifting midlatitude surface weather patterns for months. We focus on two key quantities of interest: the probability of an SSW occurring, and the expected lead time if it does occur, as functions of initial condition. These \emph{optimal forecasts} concretely measure the event's progress. Direct numerical simulation can estimate them in principle, but is prohibitively expensive in practice: each rare event requires a long integration to observe, and the cost of each integration grows with model complexity. We describe an alternative approach using integrations that are \emph{short} compared to the timescale of the warming event. We compute the probability and lead time efficiently by solving equations involving the transition operator, which encodes all information about the dynamics. We relate these optimal forecasts to a small number of interpretable physical variables, suggesting optimal measurements for forecasting. We illustrate the methodology on a prototype SSW model developed by Holton and Mass (1976) and modified by stochastic forcing. While highly idealized, this model captures the essential nonlinear dynamics of SSWs and exhibits the key forecasting challenge: the dramatic separation in timescales between a single event and the return time between successive events. Our methodology is designed to fully exploit high-dimensional data from models and observations, and has the potential to identify detailed predictors of many complex rare events in meteorology.
AI Key Findings
Get AI-generated insights about this paper's methodology, results, significance, and more — seven facets brought into focus.
Impact
Paper Details
Authors
PDF Preview
Key Terms
Citation Network
Current paper (gray), citations (green), references (blue)
Display is limited for performance on very large graphs.
Discussion 0