Learning Objectives, Insights, and Assessments: How Specification Formats Impact Design
Publication
Metrics
AI Quick Summary
This paper investigates how different specification formats—learning objectives, insights, and assessments—impact the design of visualizations. The study found that while all formats are beneficial, learning objective-based specifications were most effective in guiding participants to prefer the most effective visualizations.
Paper Preview
Abstract
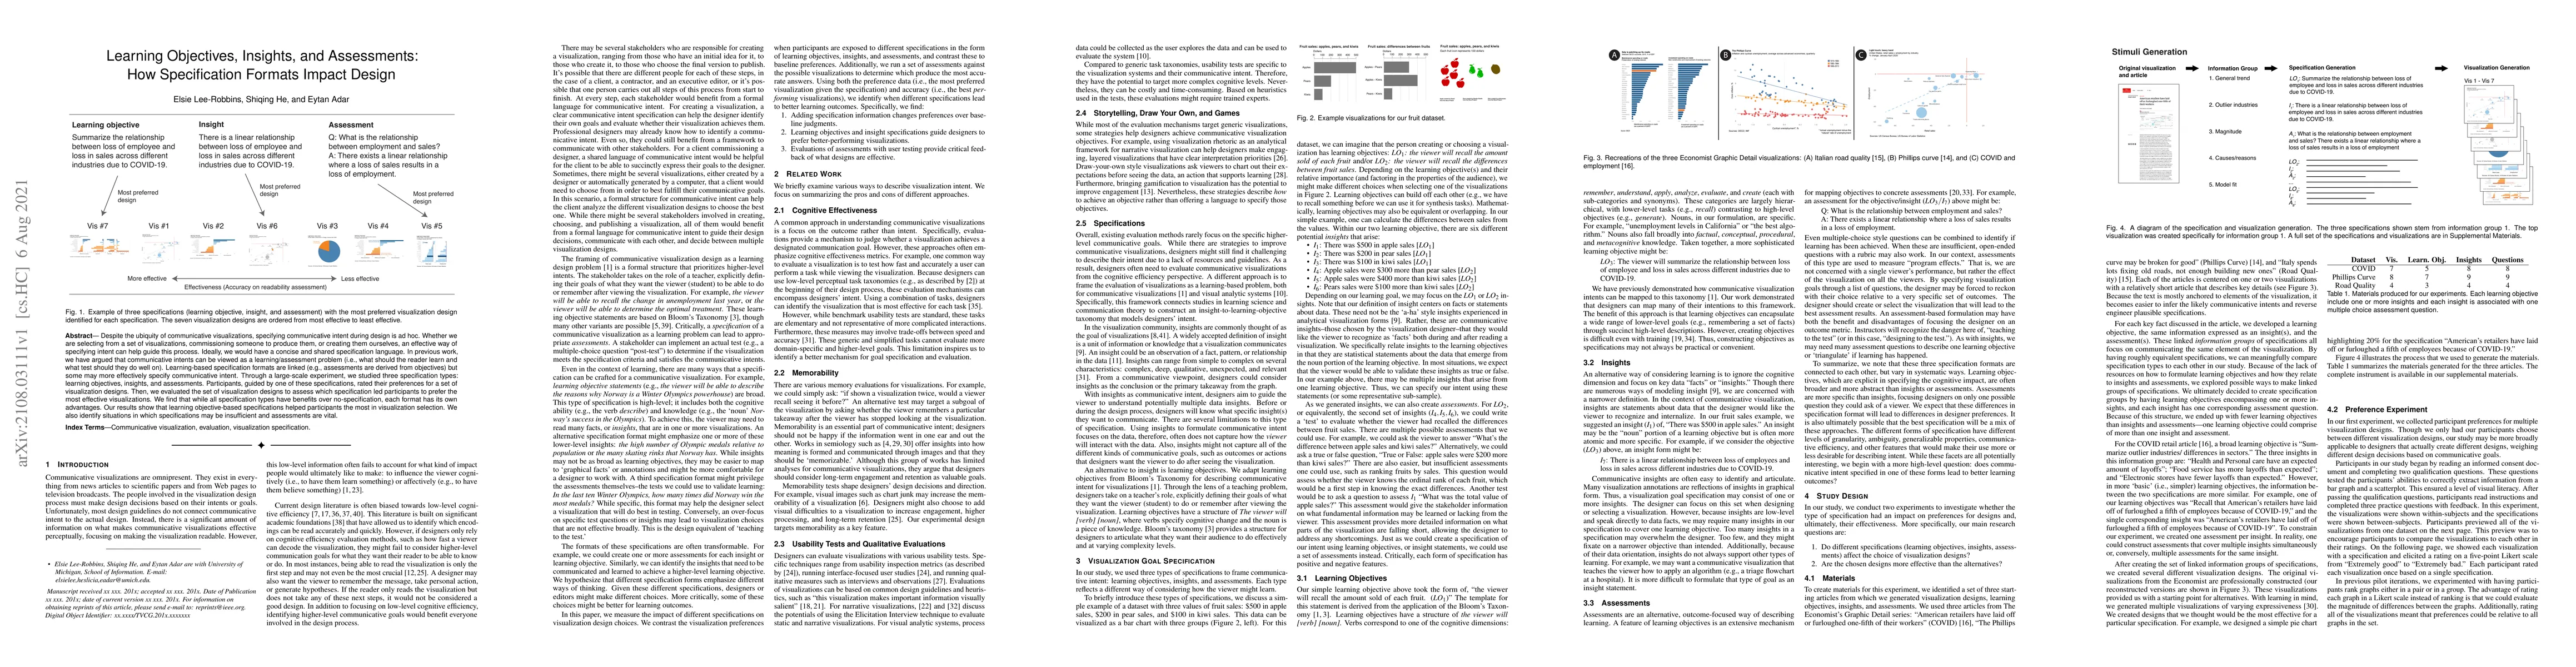
Despite the ubiquity of communicative visualizations, specifying communicative intent during design is ad hoc. Whether we are selecting from a set of visualizations, commissioning someone to produce them, or creating them ourselves, an effective way of specifying intent can help guide this process. Ideally, we would have a concise and shared specification language. In previous work, we have argued that communicative intents can be viewed as a learning/assessment problem (i.e., what should the reader learn and what test should they do well on). Learning-based specification formats are linked (e.g., assessments are derived from objectives) but some may more effectively specify communicative intent. Through a large-scale experiment, we studied three specification types: learning objectives, insights, and assessments. Participants, guided by one of these specifications, rated their preferences for a set of visualization designs. Then, we evaluated the set of visualization designs to assess which specification led participants to prefer the most effective visualizations. We find that while all specification types have benefits over no-specification, each format has its own advantages. Our results show that learning objective-based specifications helped participants the most in visualization selection. We also identify situations in which specifications may be insufficient and assessments are vital.
AI Key Findings
Get AI-generated insights about this paper's methodology, results, significance, and more — seven facets brought into focus.
Impact
Paper Details
Authors
PDF Preview
Key Terms
Citation Network
Current paper (gray), citations (green), references (blue)
Display is limited for performance on very large graphs.
Discussion 0