Publication
Metrics
AI Quick Summary
Researchers used visual tools to analyze particle production at the Large Hadron Collider, identifying interesting event classes and testing expectations about large-transverse-momentum phenomena.
Paper Preview
Abstract
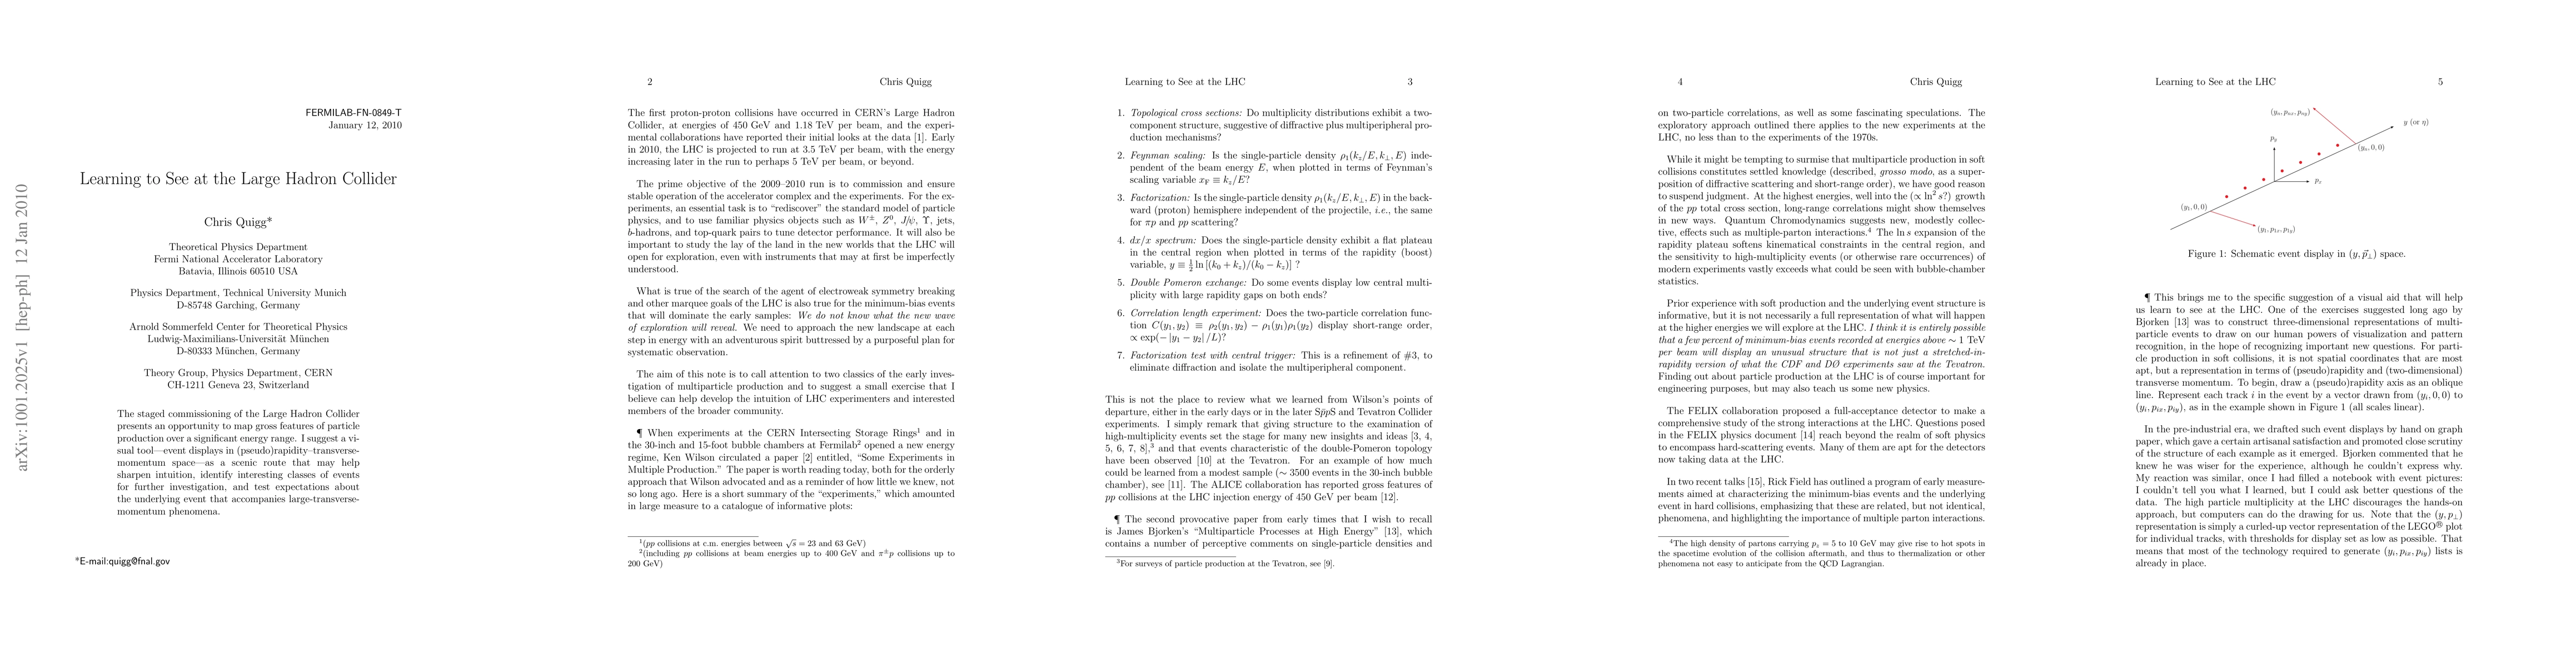
The staged commissioning of the Large Hadron Collider presents an opportunity to map gross features of particle production over a significant energy range. I suggest a visual tool - event displays in (pseudo)rapidity-transverse-momentum space - as a scenic route that may help sharpen intuition, identify interesting classes of events for further investigation, and test expectations about the underlying event that accompanies large-transverse-momentum phenomena.
AI Key Findings
Get AI-generated insights about this paper's methodology, results, significance, and more — seven facets brought into focus.
Impact
Paper Details
PDF Preview
Key Terms
Citation Network
Current paper (gray), citations (green), references (blue)
Display is limited for performance on very large graphs.
Discussion 0