Learning Visualization Policies of Augmented Reality for Human-Robot Collaboration
Publication
Metrics
AI Quick Summary
This paper introduces VARIL, a framework that enables augmented reality agents to learn visualization policies for human-robot collaboration through demonstration. Experiments in a simulated warehouse environment show that VARIL improves team efficiency and reduces user distraction compared to manual policies.
Paper Preview
Abstract
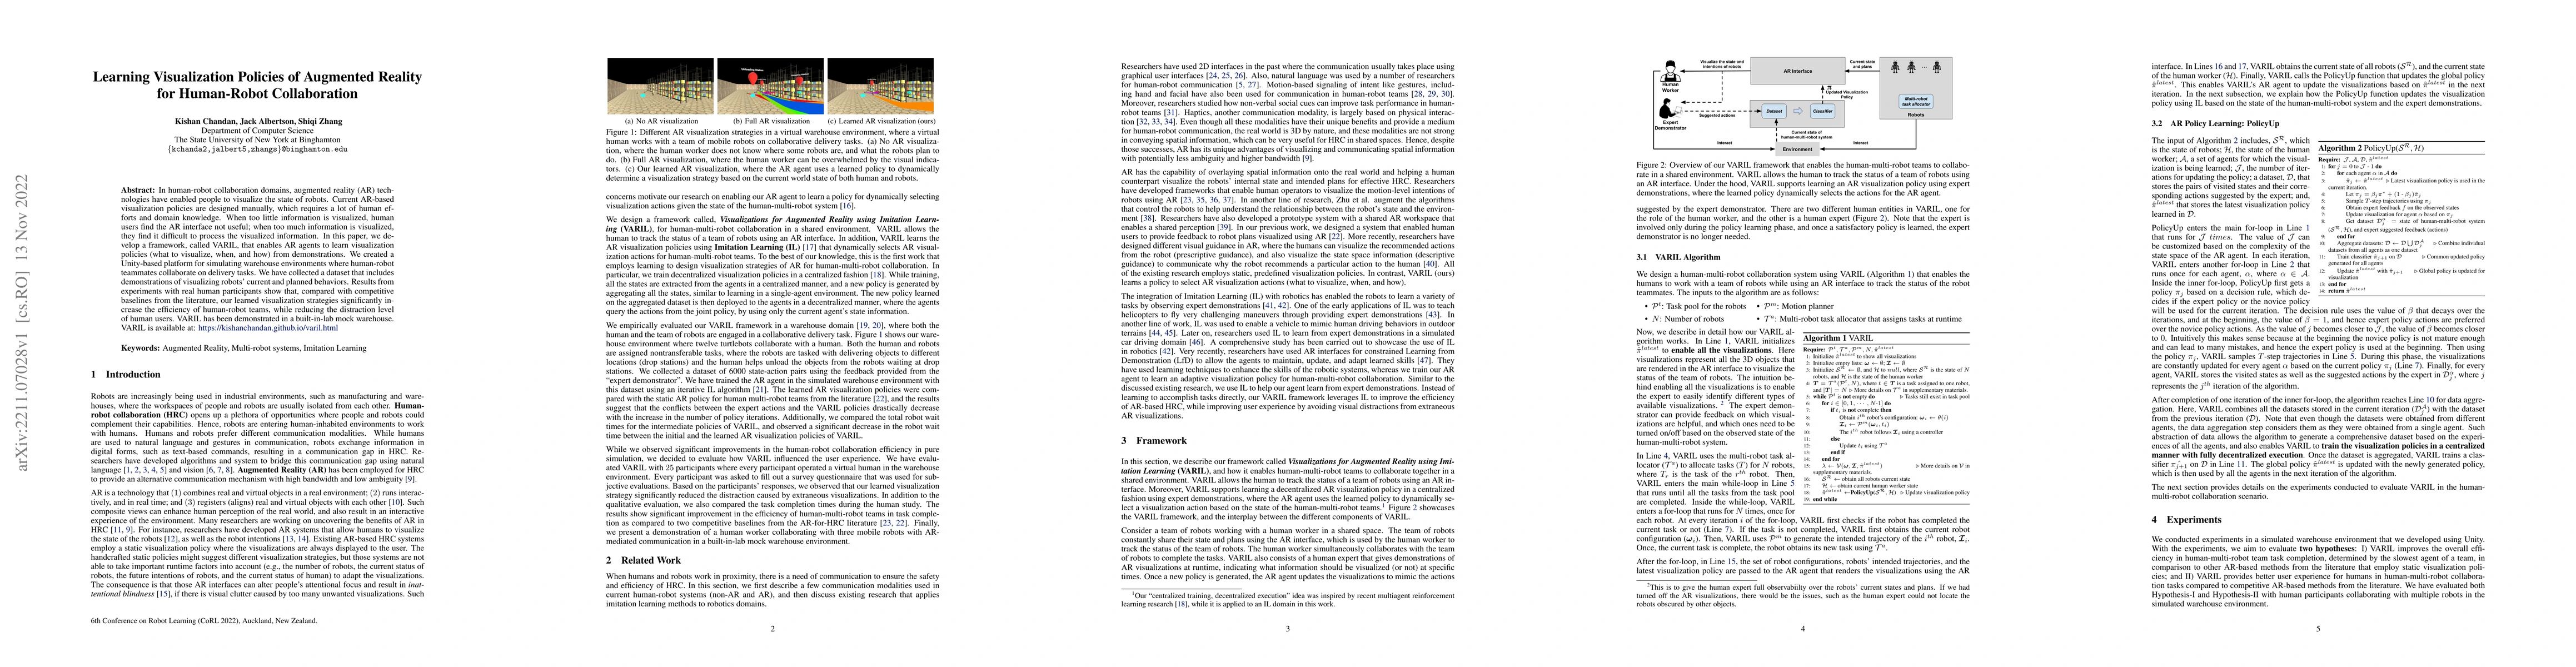
In human-robot collaboration domains, augmented reality (AR) technologies have enabled people to visualize the state of robots. Current AR-based visualization policies are designed manually, which requires a lot of human efforts and domain knowledge. When too little information is visualized, human users find the AR interface not useful; when too much information is visualized, they find it difficult to process the visualized information. In this paper, we develop a framework, called VARIL, that enables AR agents to learn visualization policies (what to visualize, when, and how) from demonstrations. We created a Unity-based platform for simulating warehouse environments where human-robot teammates collaborate on delivery tasks. We have collected a dataset that includes demonstrations of visualizing robots' current and planned behaviors. Results from experiments with real human participants show that, compared with competitive baselines from the literature, our learned visualization strategies significantly increase the efficiency of human-robot teams, while reducing the distraction level of human users. VARIL has been demonstrated in a built-in-lab mock warehouse.
AI Key Findings
Get AI-generated insights about this paper's methodology, results, significance, and more — seven facets brought into focus.
Discussion 0