LEGO: Learnable Expansion of Graph Operators for Multi-Modal Feature Fusion
Publication
Metrics
AI Quick Summary
This paper proposes a graph-based method, LEGO, for multi-modal feature fusion in computer vision, leveraging graph power expansions and learnable graph operators to capture deep interactions and structural relationships, which outperforms traditional fusion techniques in multi-representational tasks like video anomaly detection.
Paper Preview
Abstract
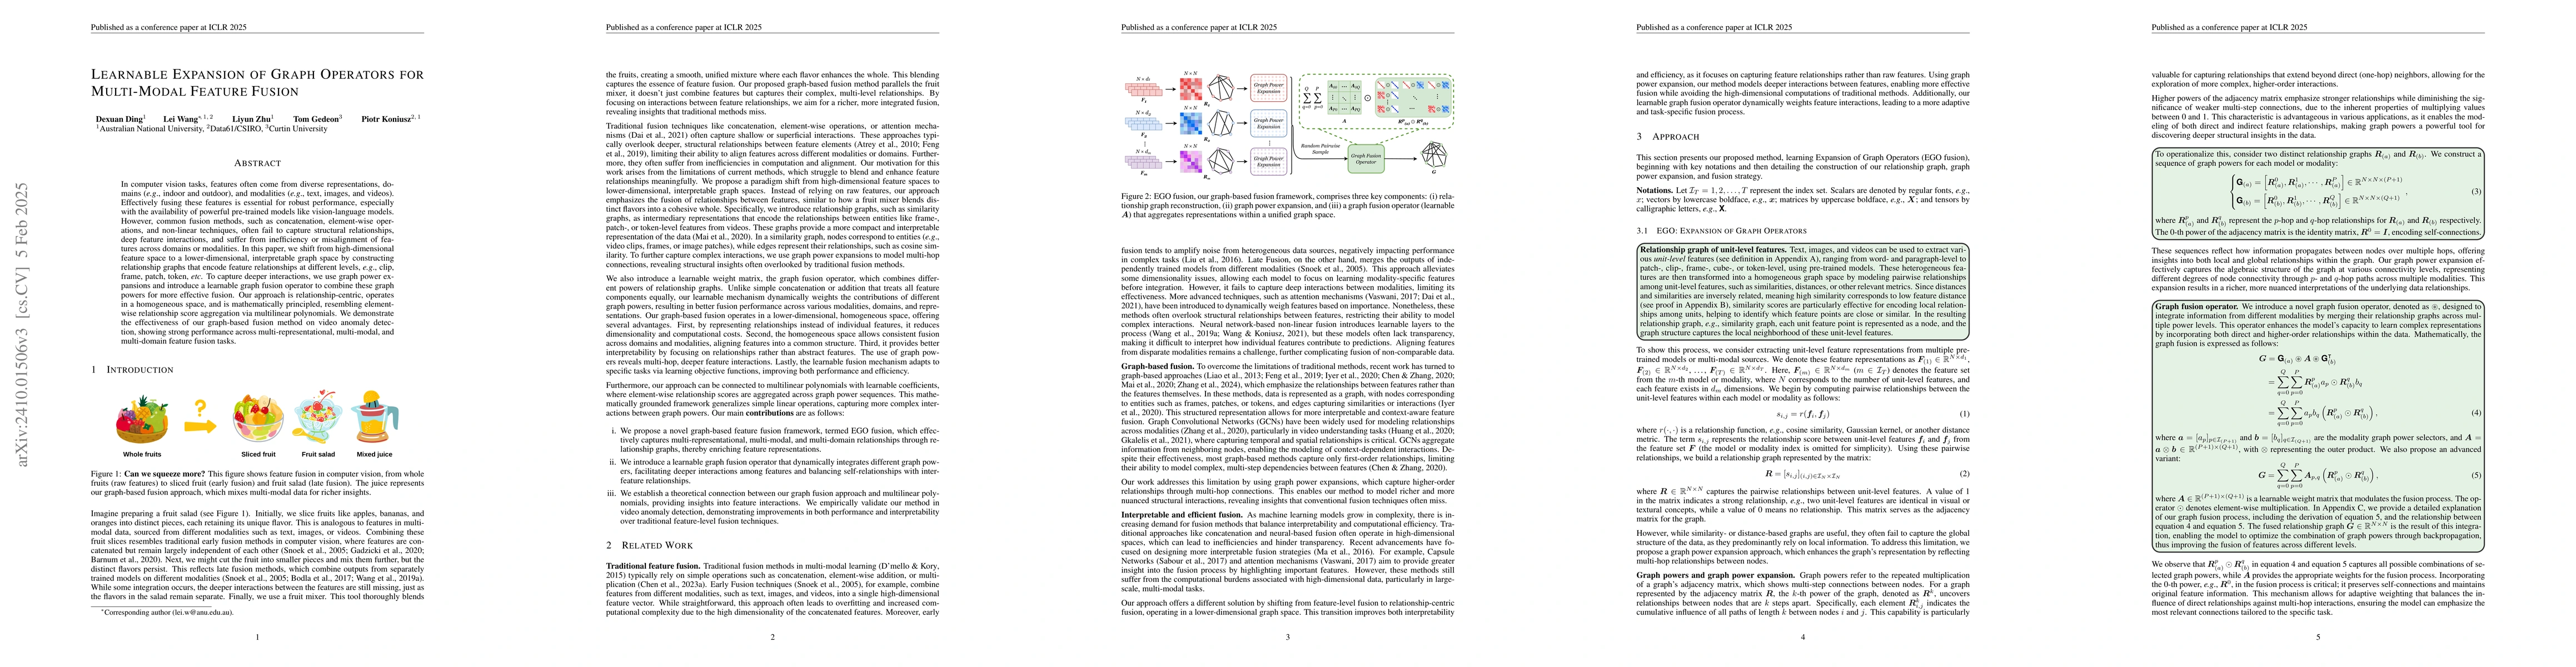
In computer vision tasks, features often come from diverse representations, domains, and modalities, such as text, images, and videos. Effectively fusing these features is essential for robust performance, especially with the availability of powerful pre-trained models like vision-language models. However, common fusion methods, such as concatenation, element-wise operations, and non-linear techniques, often fail to capture structural relationships, deep feature interactions, and suffer from inefficiency or misalignment of features across domains. In this paper, we shift from high-dimensional feature space to a lower-dimensional, interpretable graph space by constructing similarity graphs that encode feature relationships at different levels, e.g., clip, frame, patch, token, etc. To capture deeper interactions, we use graph power expansions and introduce a learnable graph fusion operator to combine these graph powers for more effective fusion. Our approach is relationship-centric, operates in a homogeneous space, and is mathematically principled, resembling element-wise similarity score aggregation via multilinear polynomials. We demonstrate the effectiveness of our graph-based fusion method on video anomaly detection, showing strong performance across multi-representational, multi-modal, and multi-domain feature fusion tasks.
AI Key Findings
Get AI-generated insights about this paper's methodology, results, significance, and more — seven facets brought into focus.
Impact
Paper Details
Authors
PDF Preview
Citation Network
Current paper (gray), citations (green), references (blue)
Display is limited for performance on very large graphs.
Discussion 0