Let's Gamble: How a Poor Visualization Can Elicit Risky Behavior
Publication
Metrics
AI Quick Summary
This study investigates how different data visualization designs influence risk perception and decision-making in a gambling context. Icon arrays promoted economically sound choices, while area proportioned triangle and circle designs increased gambling likelihood, suggesting better visualization choices can mitigate risky behavior.
Paper Preview
Abstract
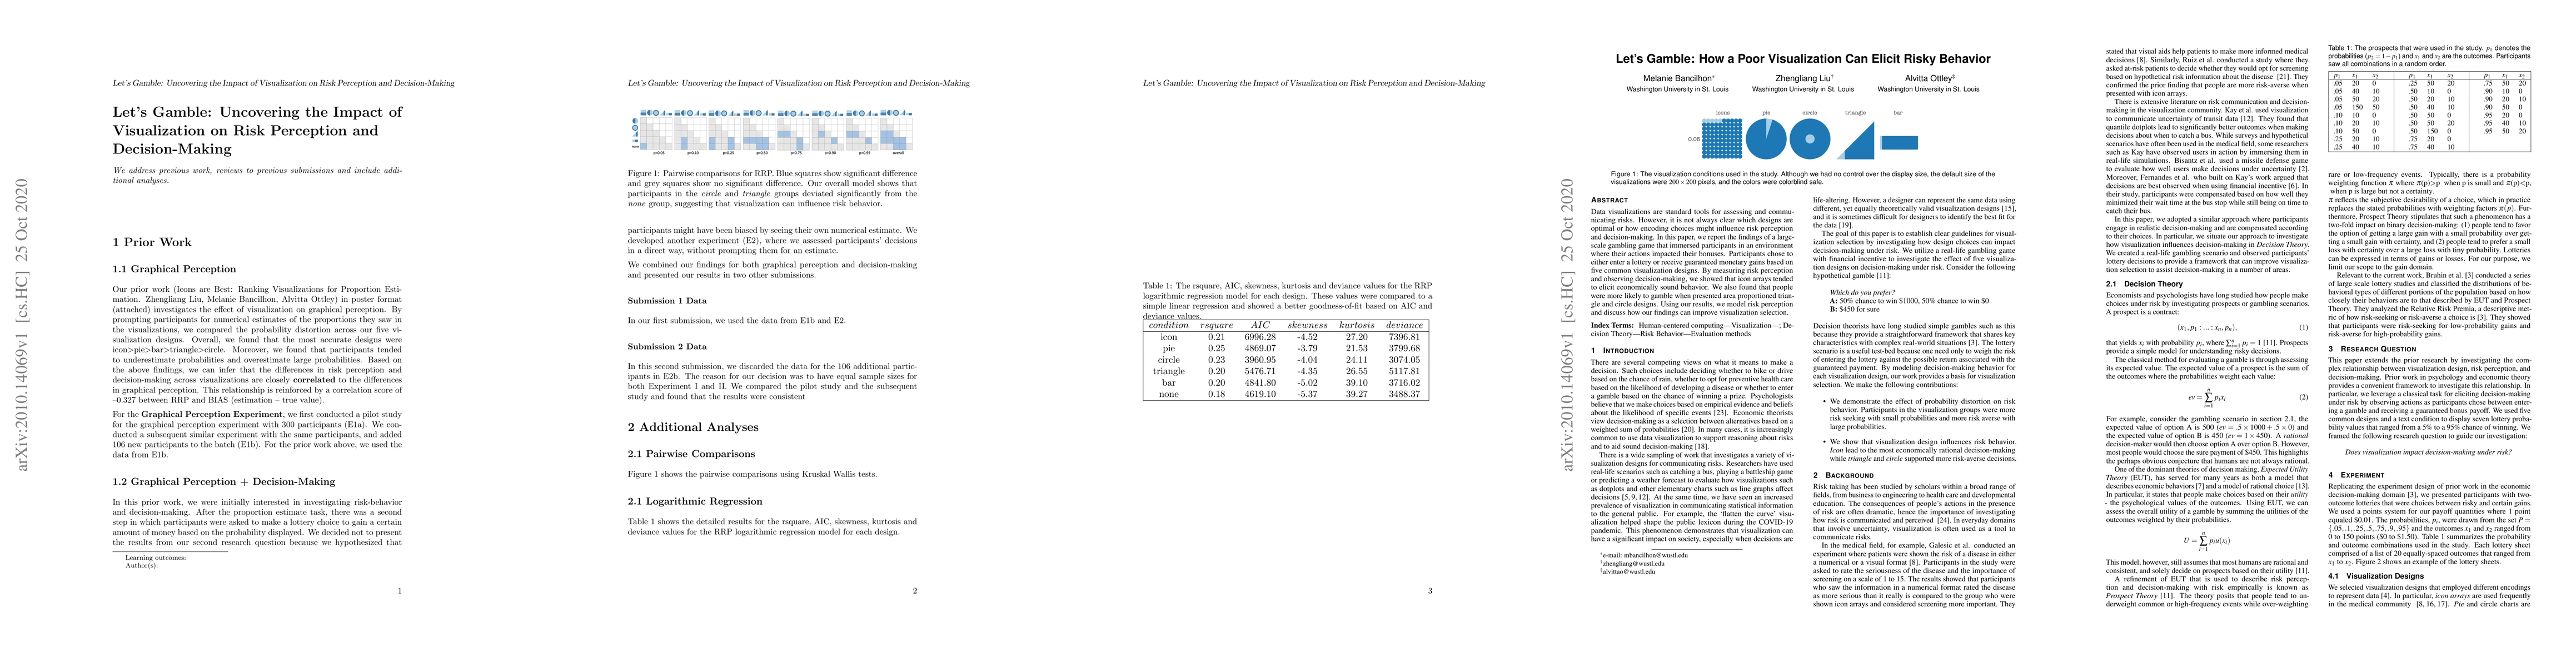
Data visualizations are standard tools for assessing and communicating risks. However, it is not always clear which designs are optimal or how encoding choices might influence risk perception and decision-making. In this paper, we report the findings of a large-scale gambling game that immersed participants in an environment where their actions impacted their bonuses. Participants chose to either enter a lottery or receive guaranteed monetary gains based on five common visualization designs. By measuring risk perception and observing decision-making, we showed that icon arrays tended to elicit economically sound behavior. We also found that people were more likely to gamble when presented area proportioned triangle and circle designs. Using our results, we model risk perception and discuss how our findings can improve visualization selection.
AI Key Findings
Get AI-generated insights about this paper's methodology, results, significance, and more — seven facets brought into focus.
Impact
Paper Details
Authors
PDF Preview
Key Terms
Citation Network
Current paper (gray), citations (green), references (blue)
Display is limited for performance on very large graphs.
Discussion 0