Publication
Metrics
Quick Actions
AI Quick Summary
This research paper presents a method for visualizing scholarly influence over time using citation networks, providing a more nuanced understanding of academic careers. The approach generates dynamic animations that highlight an individual's impact within and across fields, offering valuable insights for funding organizations and researchers.
Paper Preview
Abstract
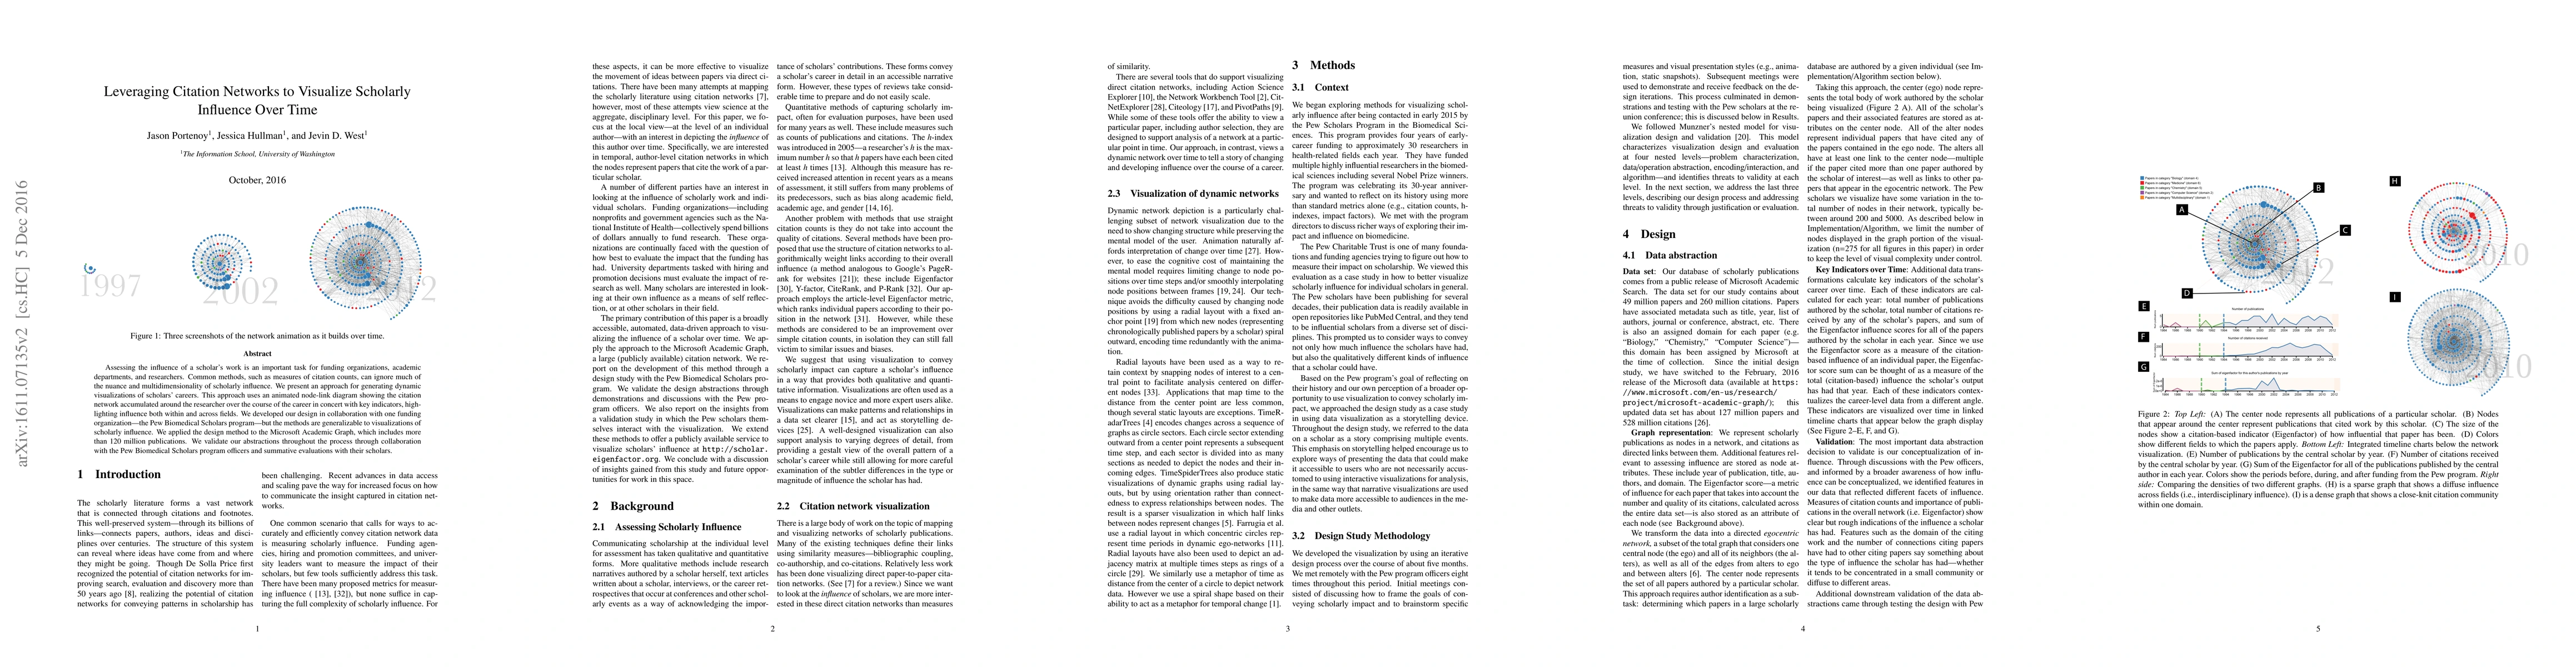
Assessing the influence of a scholar's work is an important task for funding organizations, academic departments, and researchers. Common methods, such as measures of citation counts, can ignore much of the nuance and multidimensionality of scholarly influence. We present an approach for generating dynamic visualizations of scholars' careers. This approach uses an animated node-link diagram showing the citation network accumulated around the researcher over the course of the career in concert with key indicators, highlighting influence both within and across fields. We developed our design in collaboration with one funding organization---the Pew Biomedical Scholars program---but the methods are generalizable to visualizations of scholarly influence. We applied the design method to the Microsoft Academic Graph, which includes more than 120 million publications. We validate our abstractions throughout the process through collaboration with the Pew Biomedical Scholars program officers and summative evaluations with their scholars.
AI Key Findings
Get AI-generated insights about this paper's methodology, results, and significance.
Paper Details
How to Cite This Paper
@article{anon2018leveraging,
  title         = {Leveraging Citation Networks to Visualize Scholarly Influence Over Time},
  year          = {2018},
  eprint        = {1611.07135},
  archivePrefix = {arXiv},
  primaryClass  = {cs.HC},
  doi           = {10.3389/frma.2017.00008},
}(2018). Leveraging Citation Networks to Visualize Scholarly Influence Over Time. arXiv. https://doi.org/10.3389/frma.2017.00008"Leveraging Citation Networks to Visualize Scholarly Influence Over Time." arXiv, 2018, doi.org/10.3389/frma.2017.00008.PDF Preview
Key Terms
Citation Network
Current paper (gray), citations (green), references (blue)
Display is limited for performance on very large graphs.
Similar Papers
Found 4 papersCitation Recommendation on Scholarly Legal Articles
Doğukan Arslan, Saadet Sena Erdoğan, Gülşen Eryiğit
| Title | Authors | Year | Actions |
|---|
Comments (0)