Leveraging graphical model techniques to study evolution on phylogenetic networks
Publication
Metrics
AI Quick Summary
This paper explores leveraging graphical model techniques for studying evolution on phylogenetic networks, demonstrating how belief propagation algorithms can efficiently compute likelihoods for complex, reticulate phylogenies, and presenting scalable approaches for parameter inference and computational cost reduction.
Paper Preview
Abstract
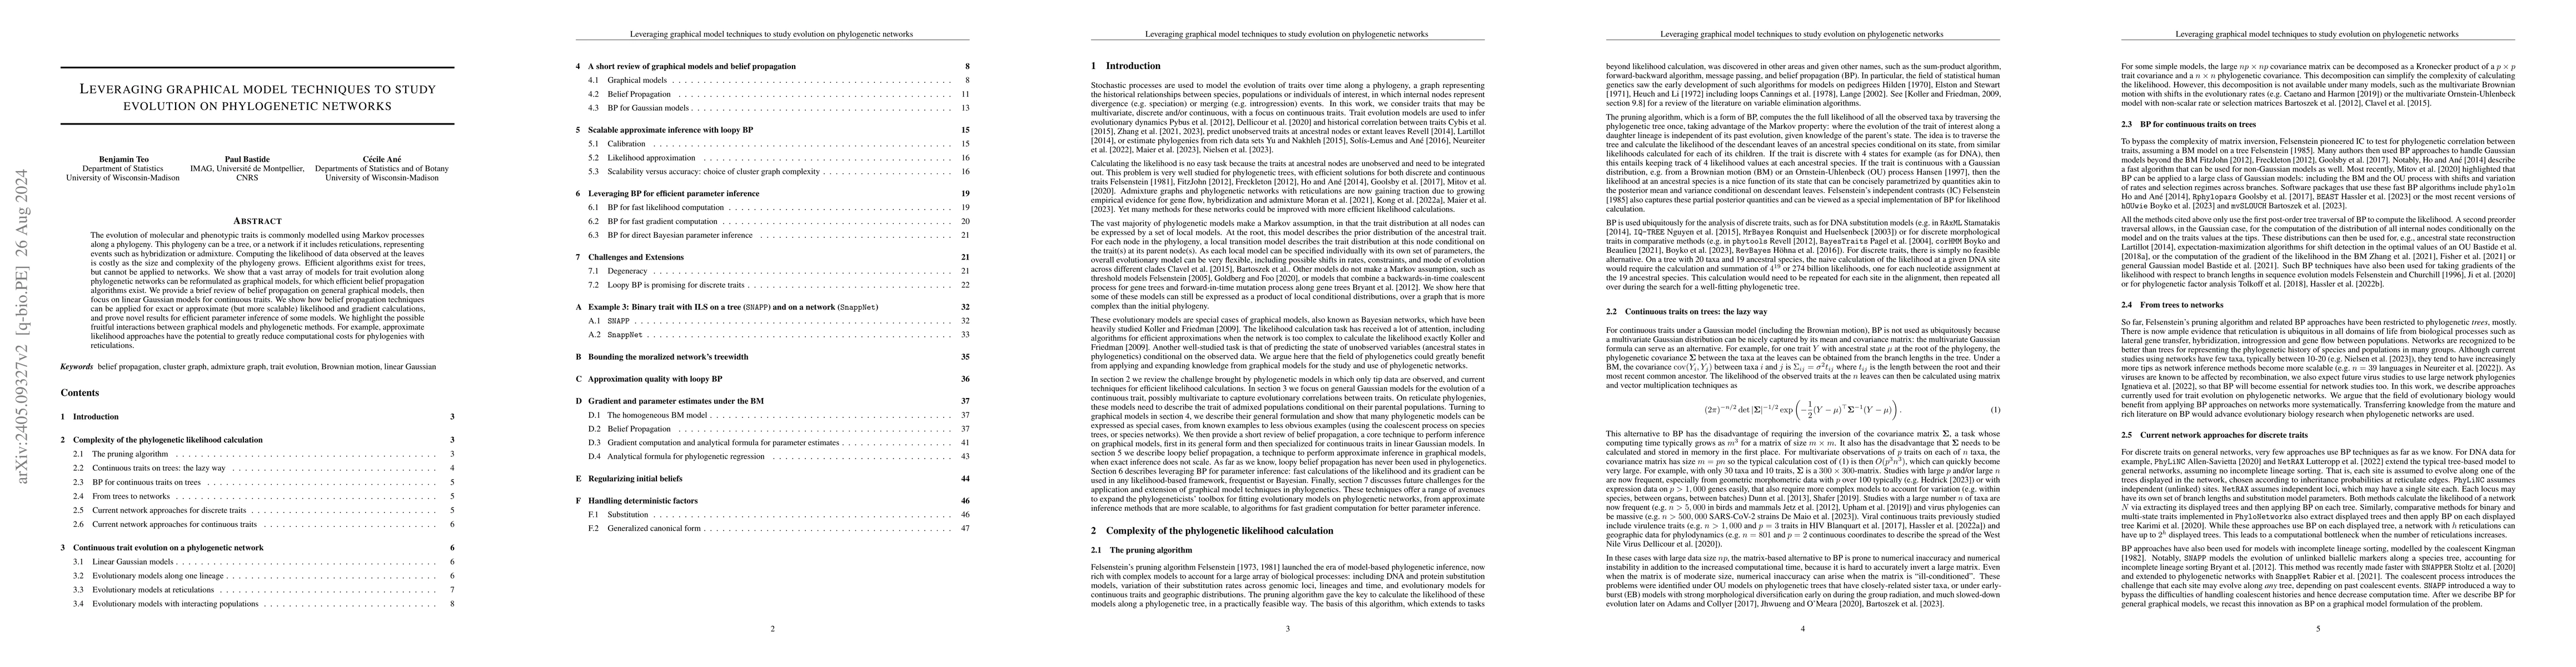
The evolution of molecular and phenotypic traits is commonly modelled using Markov processes along a rooted phylogeny. This phylogeny can be a tree, or a network if it includes reticulations, representing events such as hybridization or admixture. Computing the likelihood of data observed at the leaves is costly as the size and complexity of the phylogeny grows. Efficient algorithms exist for trees, but cannot be applied to networks. We show that a vast array of models for trait evolution along phylogenetic networks can be reformulated as graphical models, for which efficient belief propagation algorithms exist. We provide a brief review of belief propagation on general graphical models, then focus on linear Gaussian models for continuous traits. We show how belief propagation techniques can be applied for exact or approximate (but more scalable) likelihood and gradient calculations, and prove novel results for efficient parameter inference of some models. We highlight the possible fruitful interactions between graphical models and phylogenetic methods. For example, approximate likelihood approaches have the potential to greatly reduce computational costs for phylogenies with reticulations.
AI Key Findings
Get AI-generated insights about this paper's methodology, results, significance, and more — seven facets brought into focus.
Impact
Paper Details
Authors
PDF Preview
Key Terms
Citation Network
Current paper (gray), citations (green), references (blue)
Display is limited for performance on very large graphs.
Discussion 0