LIDA: A Tool for Automatic Generation of Grammar-Agnostic Visualizations and Infographics using Large Language Models
Publication
Metrics
AI Quick Summary
Summary: LIDA is a tool that automates the creation of visualizations and infographics using large language models and image generation models. It consists of four modules: a summarizer, goal explorer, visgenerator, and ingrapher, to convert data into rich summaries, enumerate visualization goals, generate visualization code, and produce stylized graphics respectively. For more details, visit the project page: https://microsoft.github.io/lida/
Paper Preview
Abstract
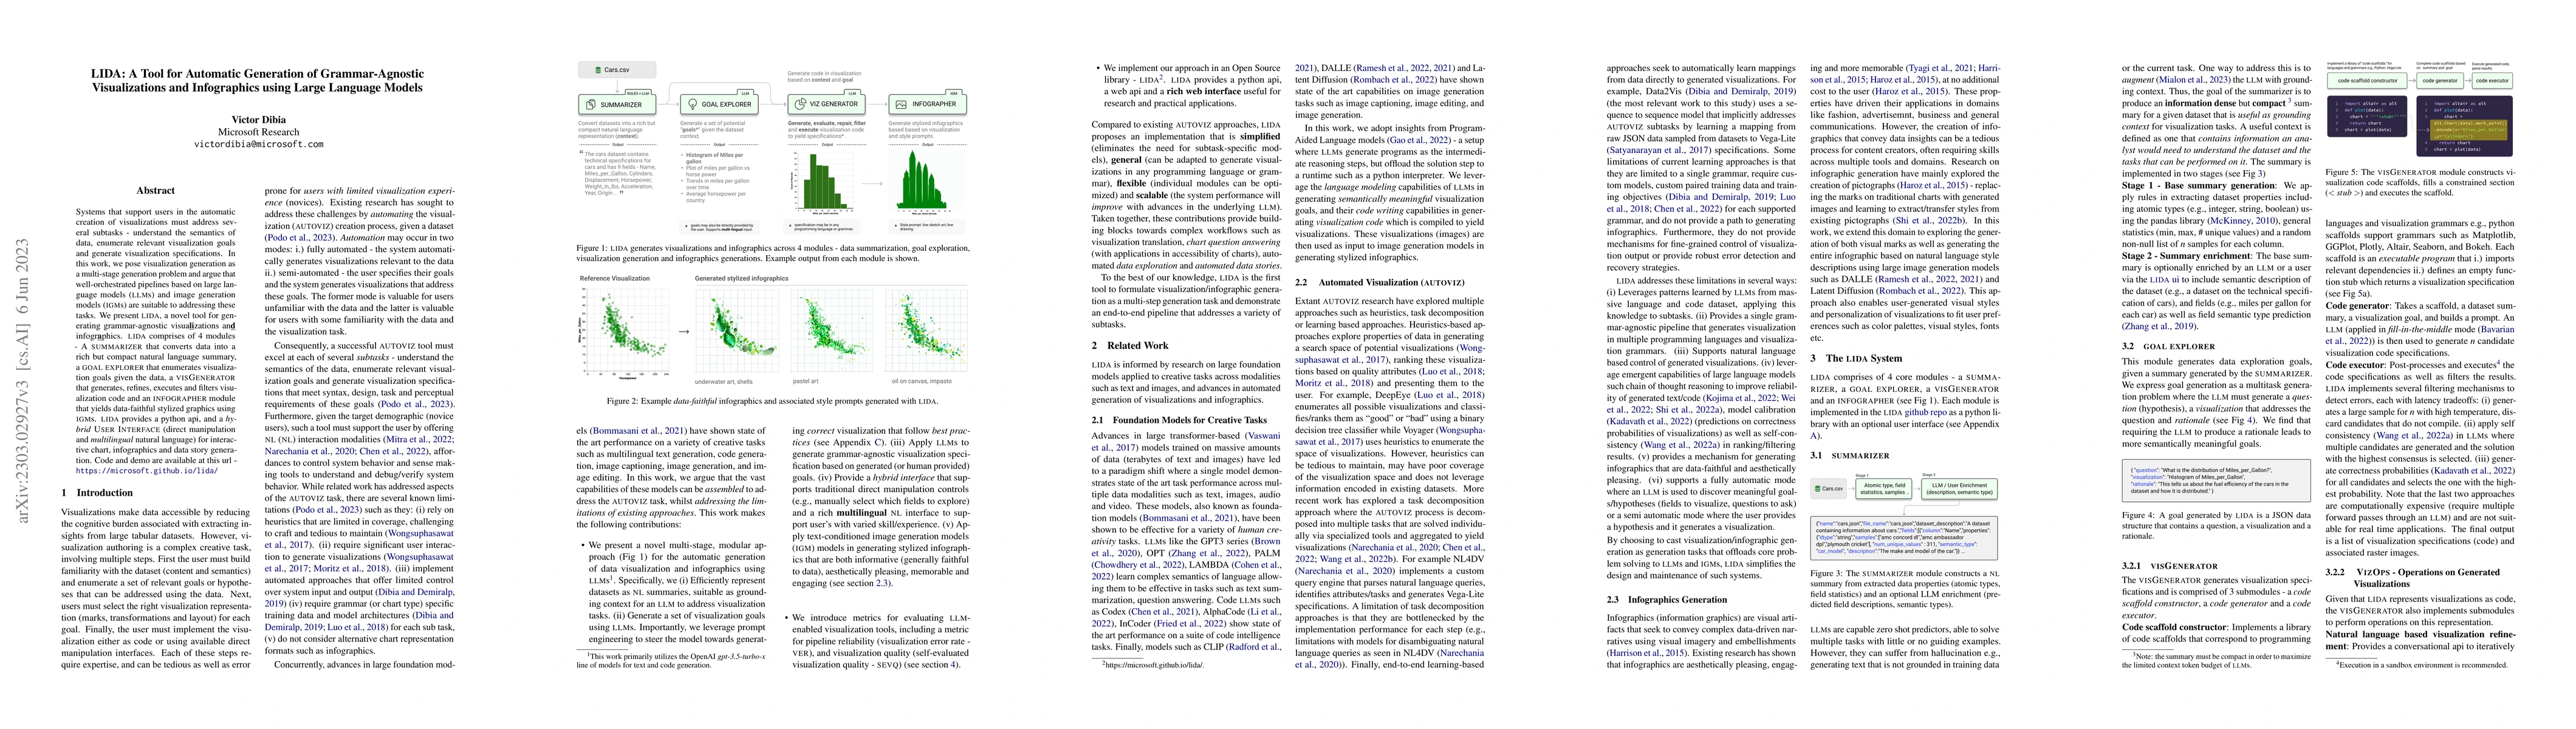
Systems that support users in the automatic creation of visualizations must address several subtasks - understand the semantics of data, enumerate relevant visualization goals and generate visualization specifications. In this work, we pose visualization generation as a multi-stage generation problem and argue that well-orchestrated pipelines based on large language models (LLMs) such as ChatGPT/GPT-4 and image generation models (IGMs) are suitable to addressing these tasks. We present LIDA, a novel tool for generating grammar-agnostic visualizations and infographics. LIDA comprises of 4 modules - A SUMMARIZER that converts data into a rich but compact natural language summary, a GOAL EXPLORER that enumerates visualization goals given the data, a VISGENERATOR that generates, refines, executes and filters visualization code and an INFOGRAPHER module that yields data-faithful stylized graphics using IGMs. LIDA provides a python api, and a hybrid user interface (direct manipulation and multilingual natural language) for interactive chart, infographics and data story generation. Learn more about the project here - https://microsoft.github.io/lida/
AI Key Findings
Get AI-generated insights about this paper's methodology, results, significance, and more — seven facets brought into focus.
Impact
Paper Details
Authors
PDF Preview
Key Terms
Citation Network
Current paper (gray), citations (green), references (blue)
Display is limited for performance on very large graphs.
Discussion 0