Line Graphics Digitization: A Step Towards Full Automation
Publication
Metrics
AI Quick Summary
This paper introduces the Line Graphics (LG) dataset, which provides pixel-wise annotations for fine-grained visual understanding of mathematical graphics, aiming to advance the automation of document digitization. The dataset will support semantic segmentation and object detection tasks, and the authors will release it publicly to encourage further research.
Paper Preview
Abstract
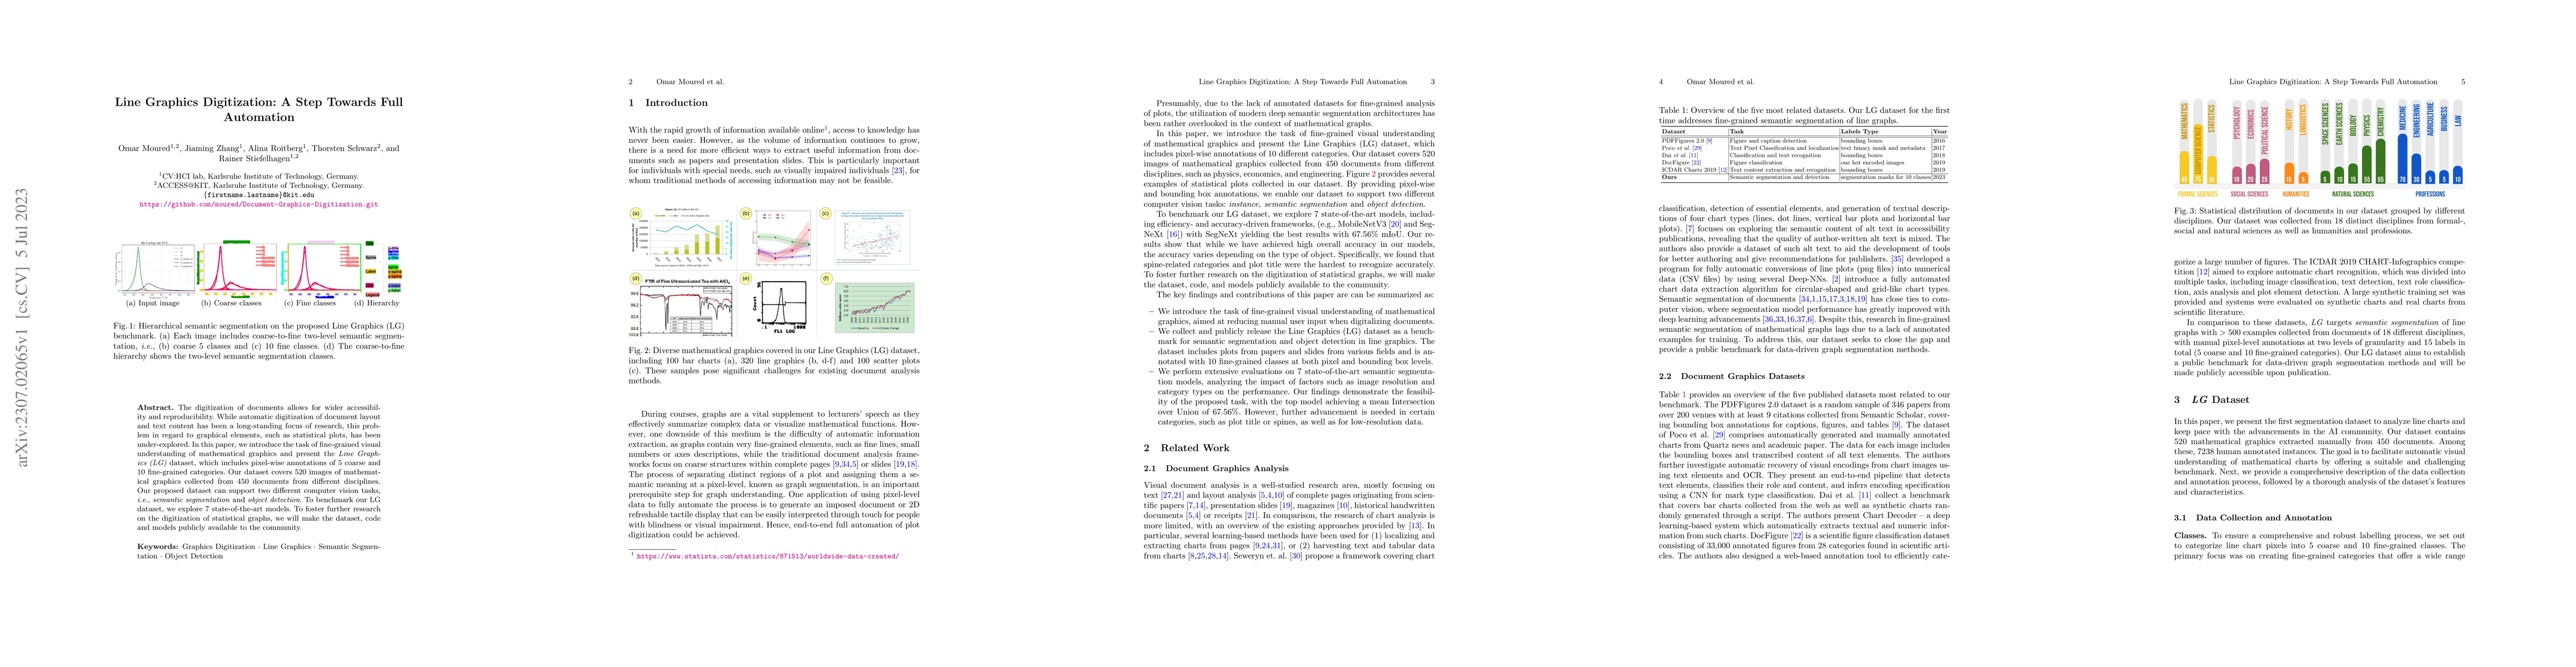
The digitization of documents allows for wider accessibility and reproducibility. While automatic digitization of document layout and text content has been a long-standing focus of research, this problem in regard to graphical elements, such as statistical plots, has been under-explored. In this paper, we introduce the task of fine-grained visual understanding of mathematical graphics and present the Line Graphics (LG) dataset, which includes pixel-wise annotations of 5 coarse and 10 fine-grained categories. Our dataset covers 520 images of mathematical graphics collected from 450 documents from different disciplines. Our proposed dataset can support two different computer vision tasks, i.e., semantic segmentation and object detection. To benchmark our LG dataset, we explore 7 state-of-the-art models. To foster further research on the digitization of statistical graphs, we will make the dataset, code, and models publicly available to the community.
AI Key Findings
Get AI-generated insights about this paper's methodology, results, significance, and more — seven facets brought into focus.
Impact
Paper Details
Authors
PDF Preview
Key Terms
Citation Network
Current paper (gray), citations (green), references (blue)
Display is limited for performance on very large graphs.
Discussion 0