Publication
Metrics
AI Quick Summary
This paper introduces a live visualization technique using heat map overlays in 3D software city metaphors to enhance program comprehension through dynamic runtime analysis. The proposed approach, implemented in the open-source ExplorViz tool, automatically renders both software cities and heat maps based on real-time data, offering an interactive and seamless visualization experience.
Paper Preview
Abstract
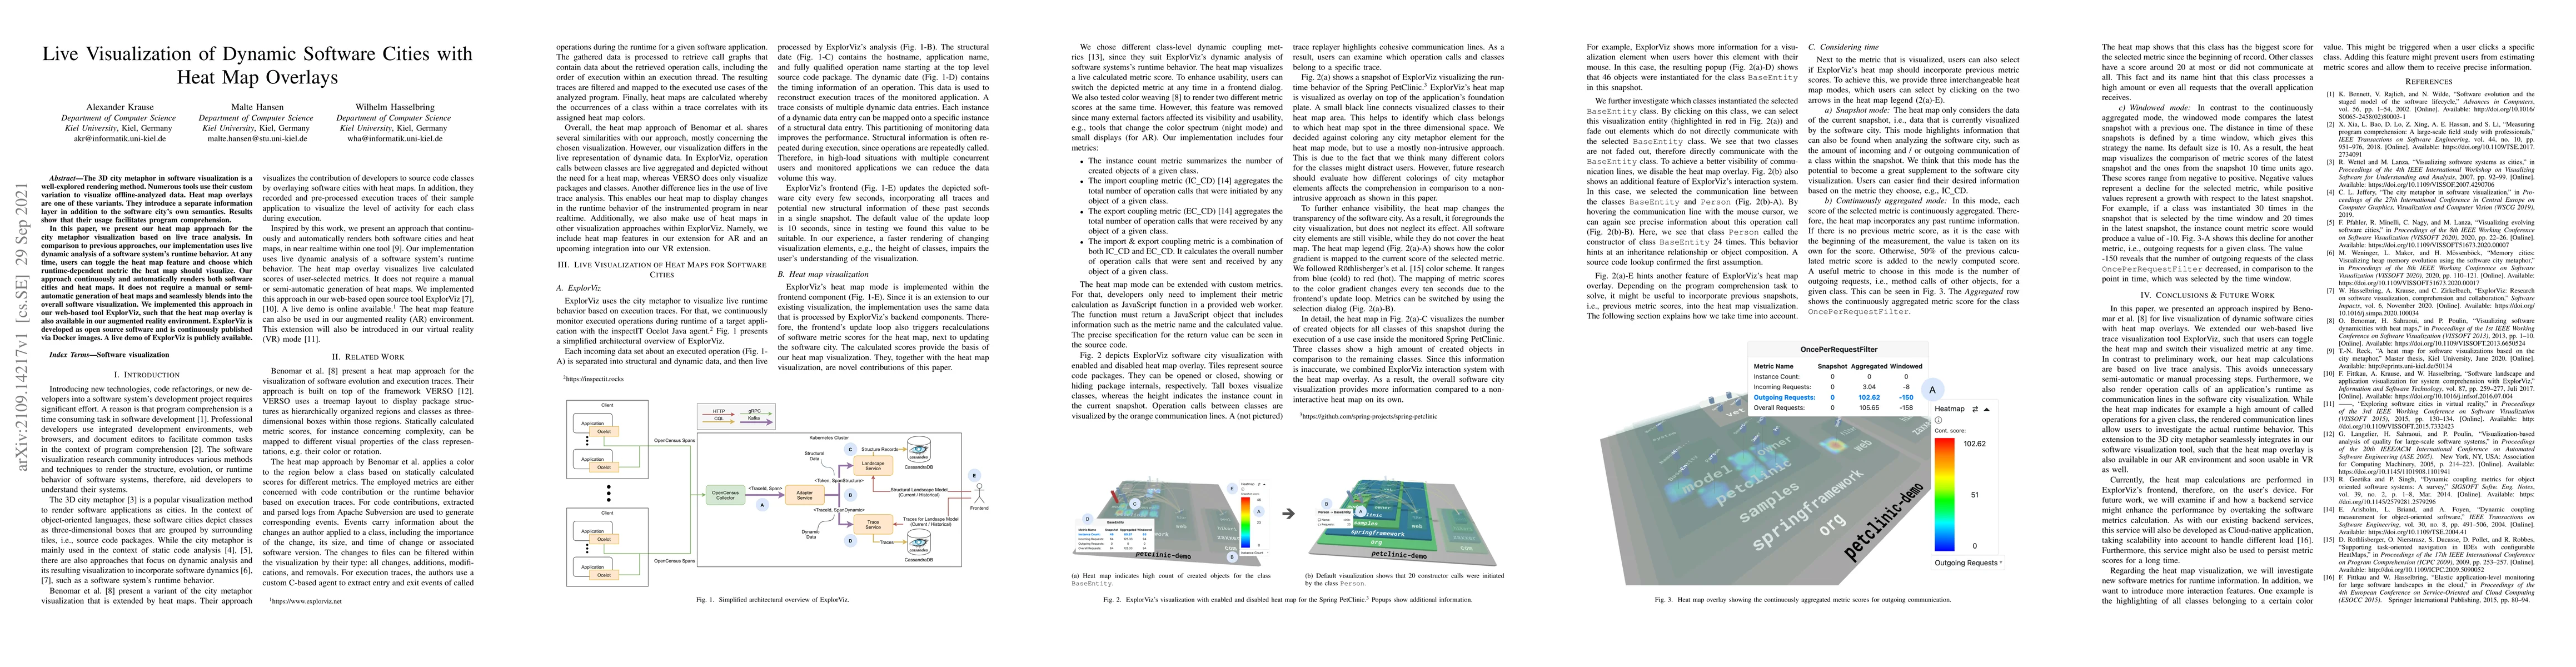
The 3D city metaphor in software visualization is a well-explored rendering method. Numerous tools use their custom variation to visualize offline-analyzed data. Heat map overlays are one of these variants. They introduce a separate information layer in addition to the software city's own semantics. Results show that their usage facilitates program comprehension. In this paper, we present our heat map approach for the city metaphor visualization based on live trace analysis. In comparison to previous approaches, our implementation uses live dynamic analysis of a software system's runtime behavior. At any time, users can toggle the heat map feature and choose which runtime-dependent metric the heat map should visualize. Our approach continuously and automatically renders both software cities and heat maps. It does not require a manual or semi-automatic generation of heat maps and seamlessly blends into the overall software visualization. We implemented this approach in our web-based tool ExplorViz, such that the heat map overlay is also available in our augmented reality environment. ExplorViz is developed as open source software and is continuously published via Docker images. A live demo of ExplorViz is publicly available.
AI Key Findings
Get AI-generated insights about this paper's methodology, results, significance, and more — seven facets brought into focus.
Impact
Paper Details
Authors
PDF Preview
Key Terms
Citation Network
Current paper (gray), citations (green), references (blue)
Display is limited for performance on very large graphs.
Discussion 0