Publication
Metrics
AI Quick Summary
Living Globe is a 3D interactive visualization application for comparing demographic data across countries over time. It supports detailed exploration of population metrics and allows user customization for advanced mappings, with positive evaluation results from heuristic and usability tests.
Paper Preview
Abstract
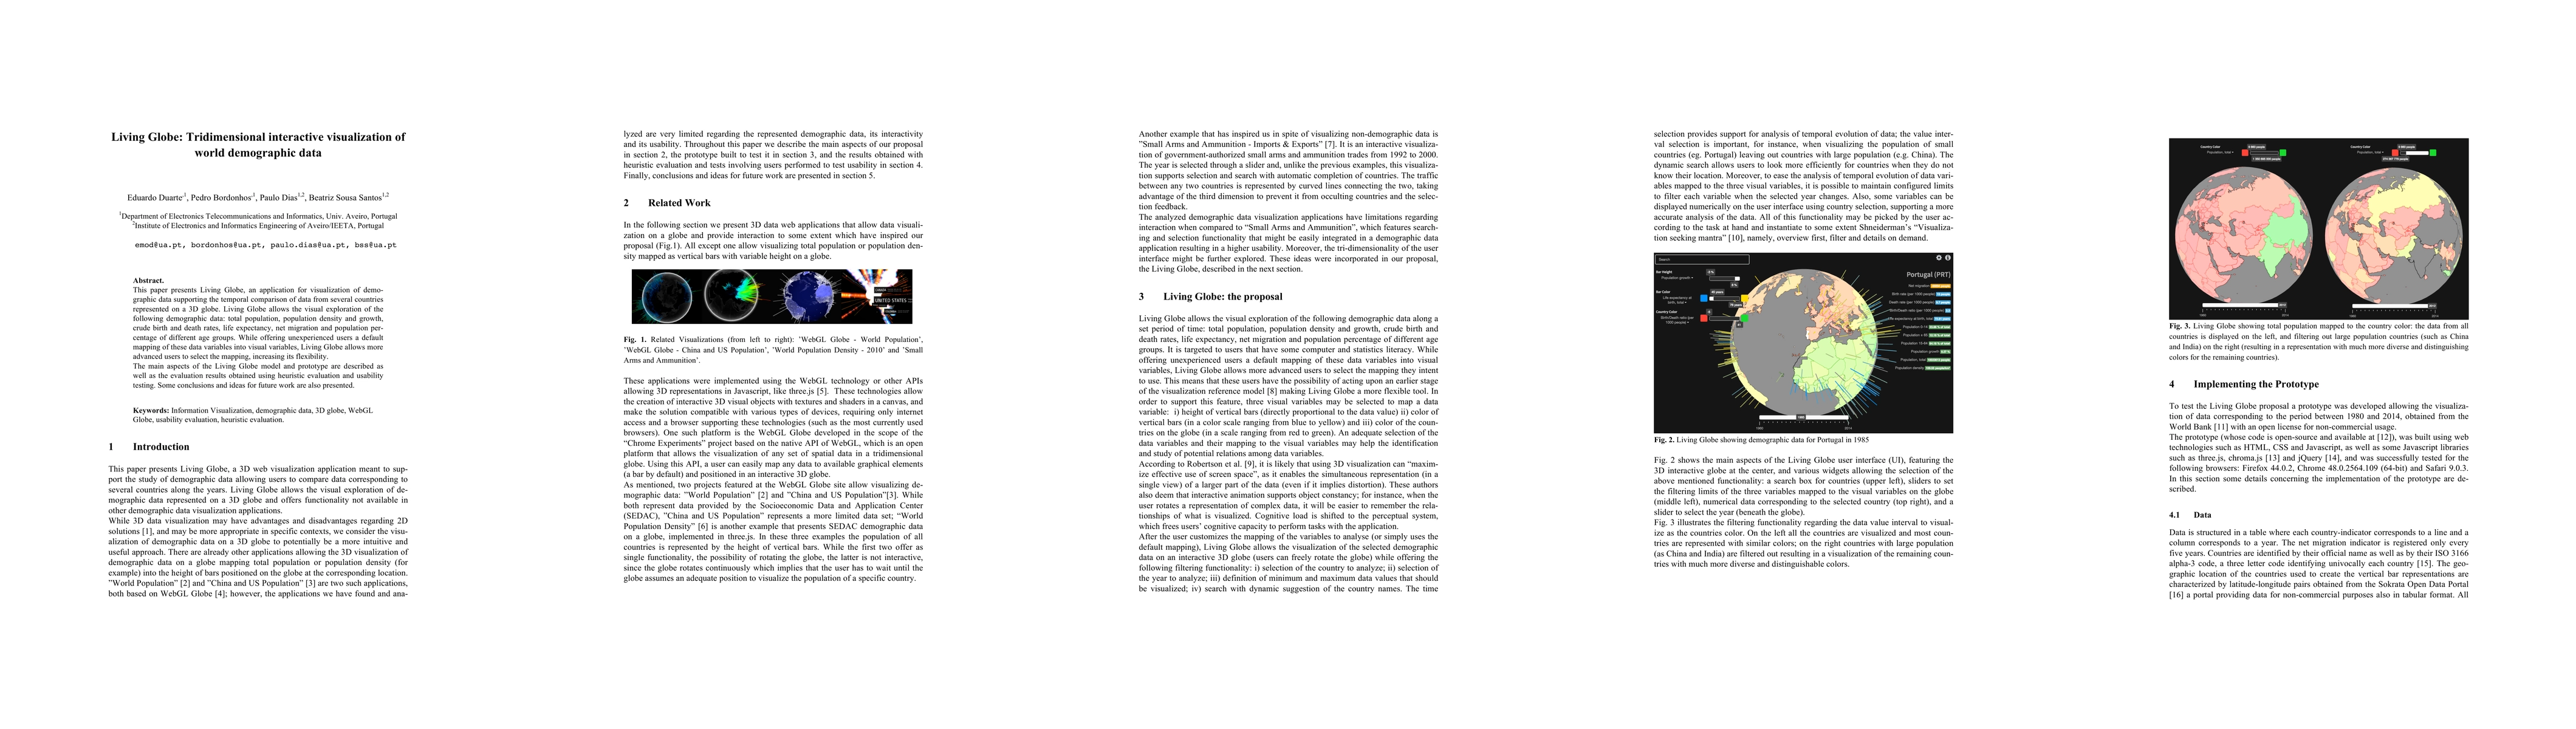
This paper presents Living Globe, an application for visualization of demo- graphic data supporting the temporal comparison of data from several countries represented on a 3D globe. Living Globe allows the visual exploration of the following demographic data: total population, population density and growth, crude birth and death rates, life expectancy, net migration and population per- centage of different age groups. While offering unexperienced users a default mapping of these data variables into visual variables, Living Globe allows more advanced users to select the mapping, increasing its flexibility. The main aspects of the Living Globe model and prototype are described as well as the evaluation results obtained using heuristic evaluation and usability testing. Some conclusions and ideas for future work are also presented.
AI Key Findings
Get AI-generated insights about this paper's methodology, results, significance, and more — seven facets brought into focus.
Impact
Paper Details
PDF Preview
Key Terms
Citation Network
Current paper (gray), citations (green), references (blue)
Display is limited for performance on very large graphs.
Discussion 0