Load Dependence of Power Outage Statistics
Publication
Metrics
AI Quick Summary
Power outage statistics depend on load levels, with larger events more likely at higher loads and varying responses across regions in the US. A model can identify vulnerable areas before major blackouts.
Paper Preview
Abstract
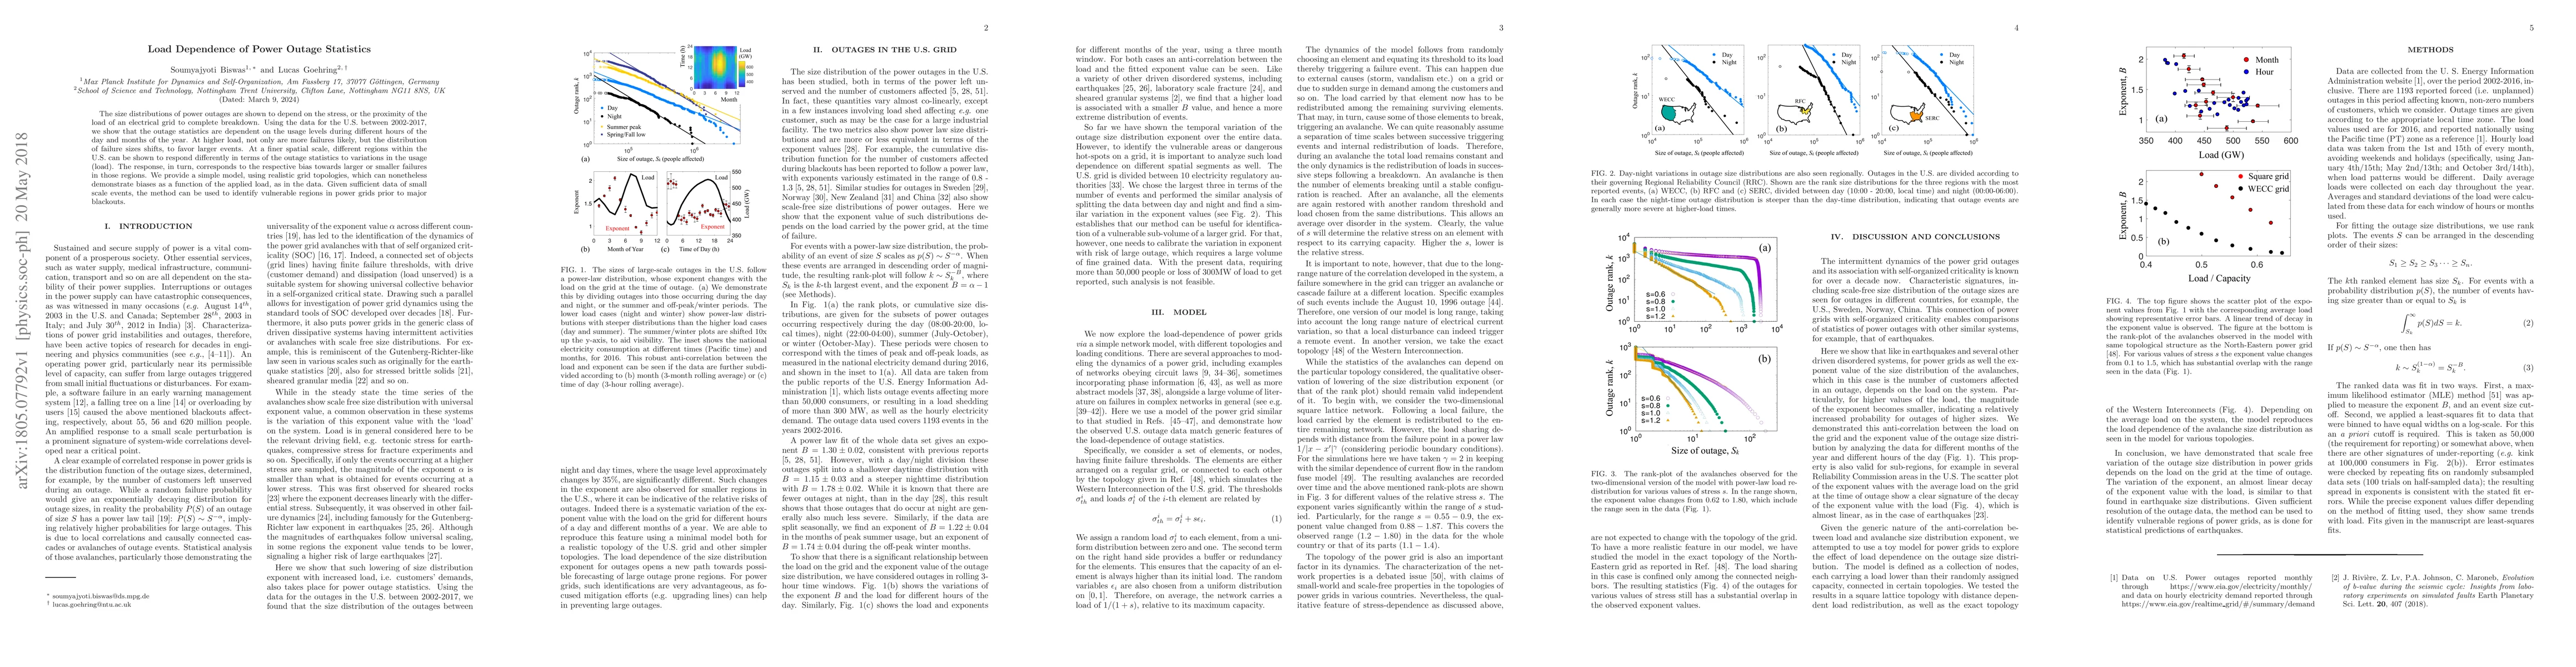
The size distributions of power outages are shown to depend on the stress, or the proximity of the load of an electrical grid to complete breakdown. Using the data for the U.S. between 2002-2017, we show that the outage statistics are dependent on the usage levels during different hours of the day and months of the year. At higher load, not only are more failures likely, but the distribution of failure sizes shifts, to favor larger events. At a finer spatial scale, different regions within the U.S. can be shown to respond differently in terms of the outage statistics to variations in the usage (load). The response, in turn, corresponds to the respective bias towards larger or smaller failures in those regions. We provide a simple model, using realistic grid topologies, which can nonetheless demonstrate biases as a function of the applied load, as in the data. Given sufficient data of small scale events, the method can be used to identify vulnerable regions in power grids prior to major blackouts.
AI Key Findings
Get AI-generated insights about this paper's methodology, results, significance, and more — seven facets brought into focus.
Impact
Paper Details
Authors
PDF Preview
Key Terms
Citation Network
Current paper (gray), citations (green), references (blue)
Display is limited for performance on very large graphs.
Discussion 0