Local Adaptive Grouped Regularization and its Oracle Properties for Varying Coefficient Regression
Publication
Metrics
AI Quick Summary
This paper introduces a local adaptive grouped regularization (LAGR) method for spatially varying coefficient regression, enabling local variable selection and coefficient estimation. The LAGR method demonstrates oracle properties under local linear and generalized linear regression, and its performance is validated through simulations and an application to the Boston housing price dataset.
Paper Preview
Abstract
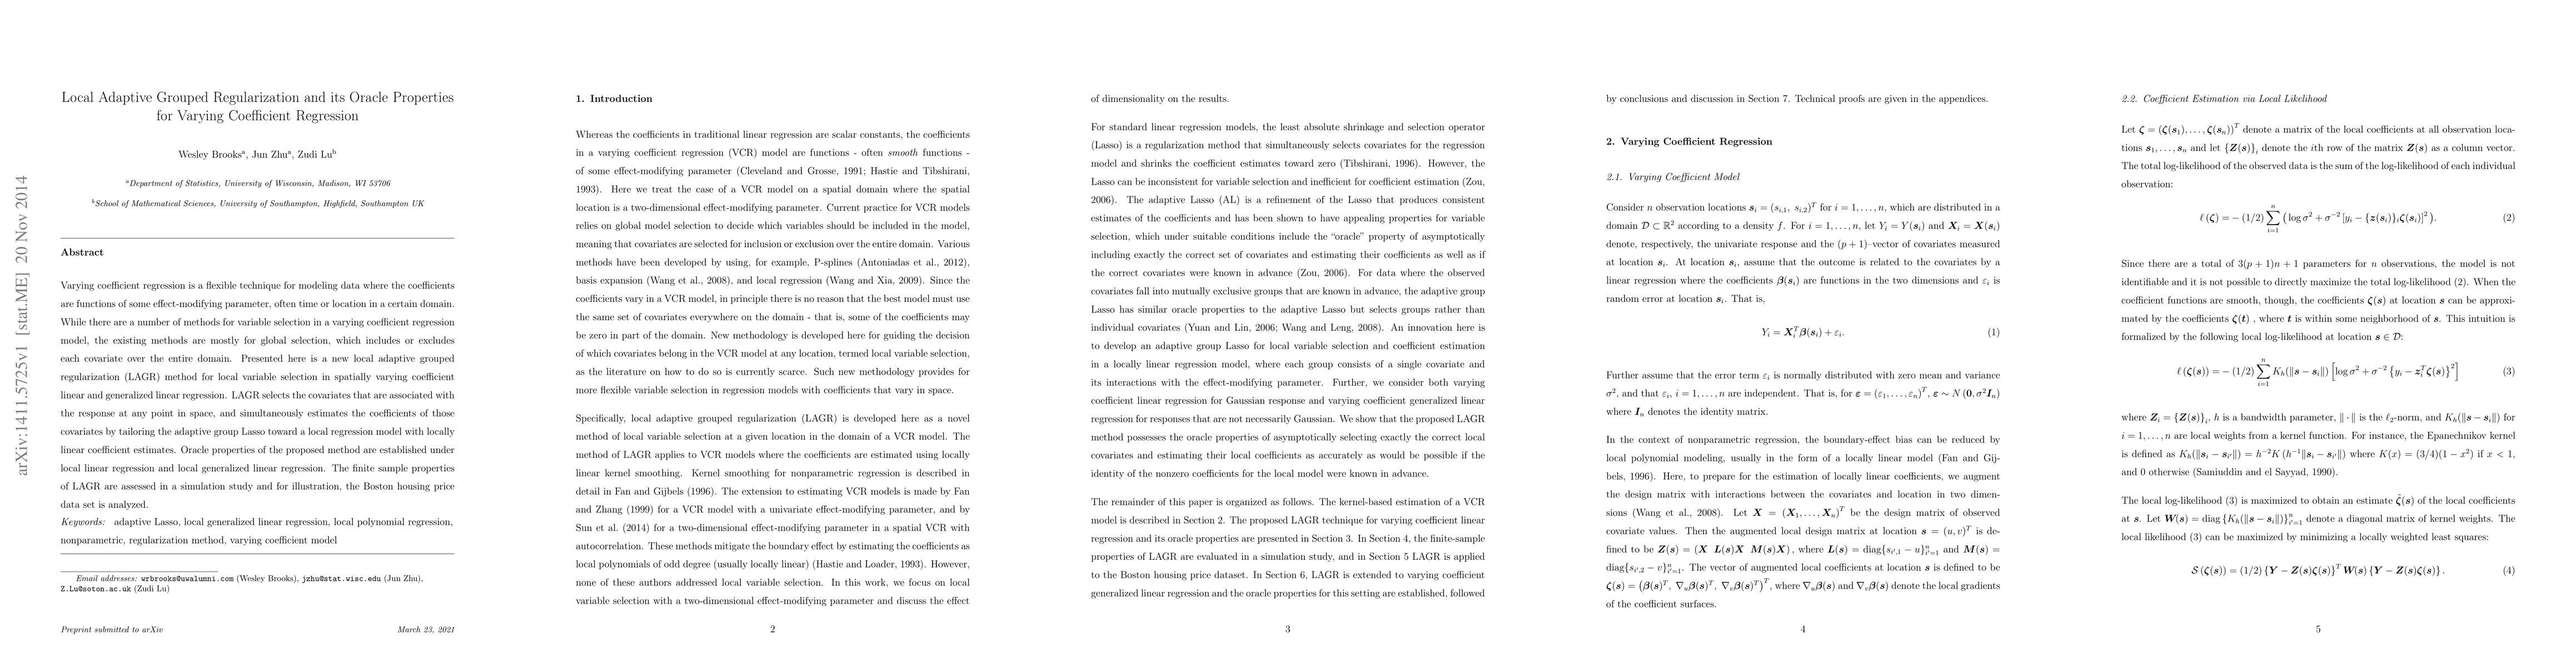
Varying coefficient regression is a flexible technique for modeling data where the coefficients are functions of some effect-modifying parameter, often time or location in a certain domain. While there are a number of methods for variable selection in a varying coefficient regression model, the existing methods are mostly for global selection, which includes or excludes each covariate over the entire domain. Presented here is a new local adaptive grouped regularization (LAGR) method for local variable selection in spatially varying coefficient linear and generalized linear regression. LAGR selects the covariates that are associated with the response at any point in space, and simultaneously estimates the coefficients of those covariates by tailoring the adaptive group Lasso toward a local regression model with locally linear coefficient estimates. Oracle properties of the proposed method are established under local linear regression and local generalized linear regression. The finite sample properties of LAGR are assessed in a simulation study and for illustration, the Boston housing price data set is analyzed.
AI Key Findings
Get AI-generated insights about this paper's methodology, results, significance, and more — seven facets brought into focus.
Impact
Paper Details
PDF Preview
Key Terms
Citation Network
Current paper (gray), citations (green), references (blue)
Display is limited for performance on very large graphs.
Discussion 0