Publication
Metrics
AI Quick Summary
Gladders et al. propose that log-normal functions best describe the star formation histories (SFHs) of galaxies, fitting 85% of simulated and observed SFHs within 5% error. The log-normal model outperforms the delayed-tau model and correlates well with the evolution of galaxies across the star formation main sequence.
Paper Preview
Abstract
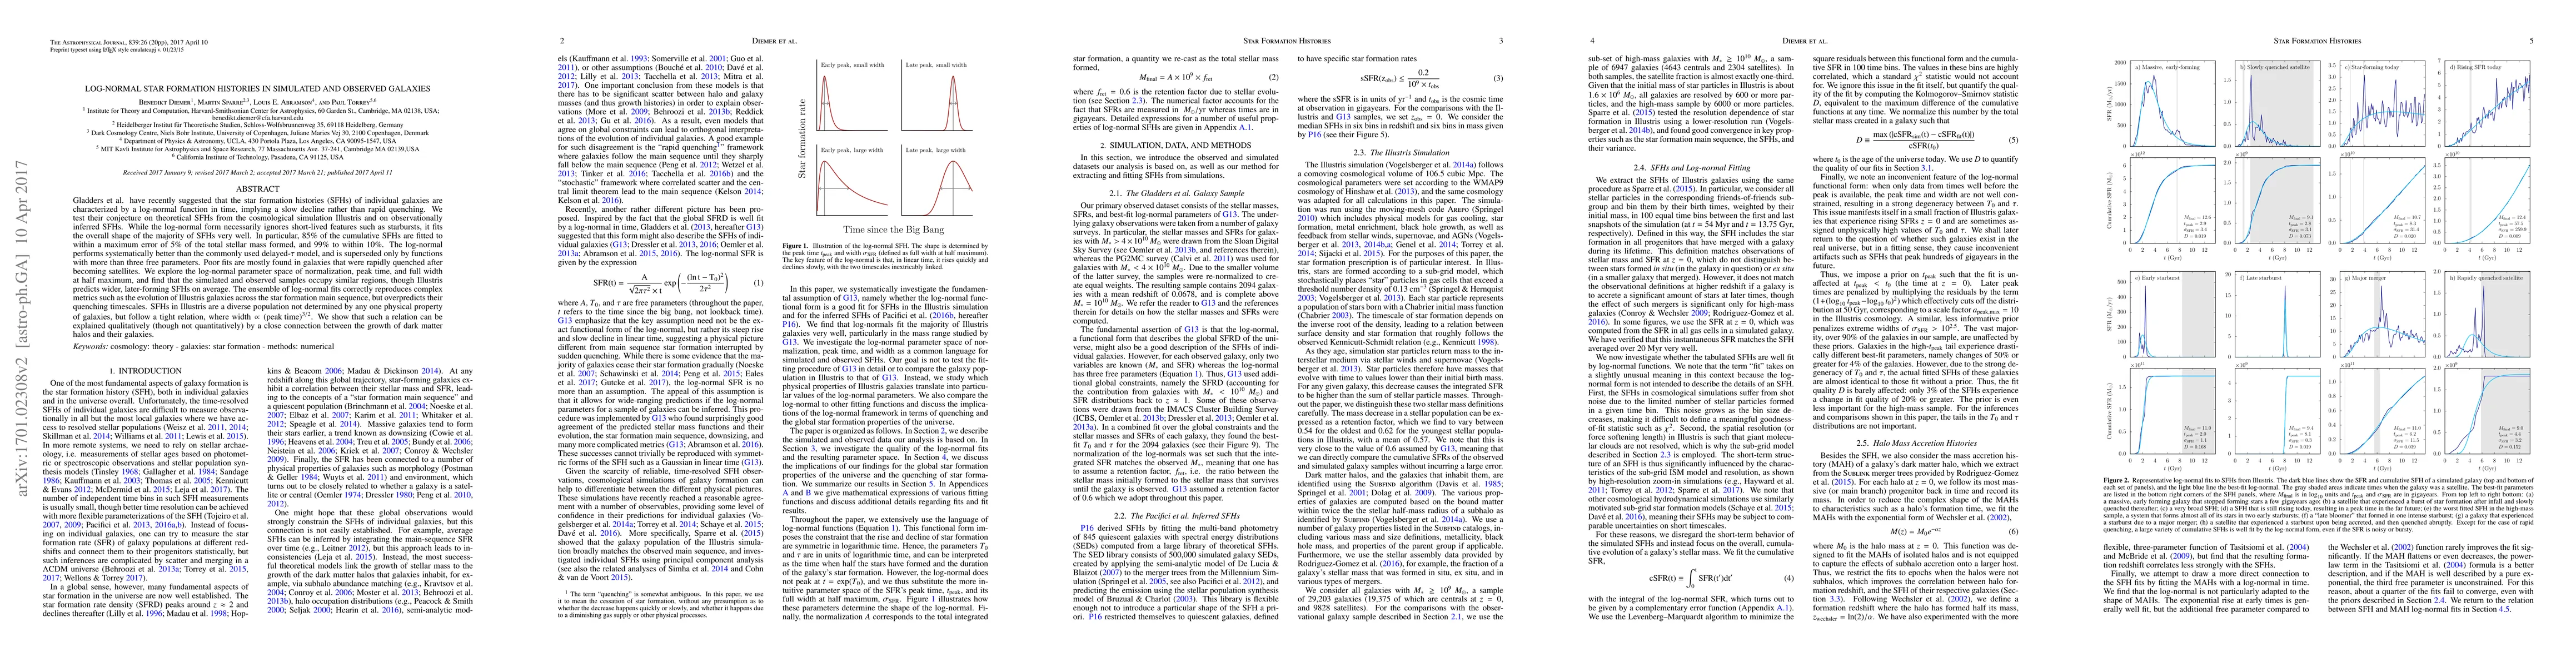
Gladders et al. have recently suggested that the star formation histories (SFHs) of individual galaxies are characterized by a log-normal function in time, implying a slow decline rather than rapid quenching. We test their conjecture on theoretical SFHs from the cosmological simulation Illustris and on observationally inferred SFHs. While the log-normal form necessarily ignores short-lived features such as starbursts, it fits the overall shape of the majority of SFHs very well. In particular, 85% of the cumulative SFHs are fitted to within a maximum error of 5% of the total stellar mass formed, and 99% to within 10%. The log-normal performs systematically better than the commonly used delayed-tau model, and is superseded only by functions with more than three free parameters. Poor fits are mostly found in galaxies that were rapidly quenched after becoming satellites. We explore the log-normal parameter space of normalization, peak time, and full width at half maximum, and find that the simulated and observed samples occupy similar regions, though Illustris predicts wider, later-forming SFHs on average. The ensemble of log-normal fits correctly reproduces complex metrics such as the evolution of Illustris galaxies across the star formation main sequence, but overpredicts their quenching timescales. SFHs in Illustris are a diverse population not determined by any one physical property of galaxies, but follow a tight relation, where $\mathrm{width}\propto\mathrm{(peak\ time)}^{3/2}$. We show that such a relation can be explained qualitatively (though not quantitatively) by a close connection between the growth of dark matter halos and their galaxies.
AI Key Findings
Get AI-generated insights about this paper's methodology, results, significance, and more — seven facets brought into focus.
Impact
Paper Details
PDF Preview
Key Terms
Citation Network
Current paper (gray), citations (green), references (blue)
Display is limited for performance on very large graphs.
Discussion 0