Publication
Metrics
AI Quick Summary
This paper introduces a novel algorithm for selecting graphical loglinear models, particularly suited for analyzing hyper-sparse contingency tables. It applies these methods to model human mobility patterns using a dataset of geolocated tweets from South Africa, summarizing 46 million location data points into a 214-variable contingency table.
Paper Preview
Abstract
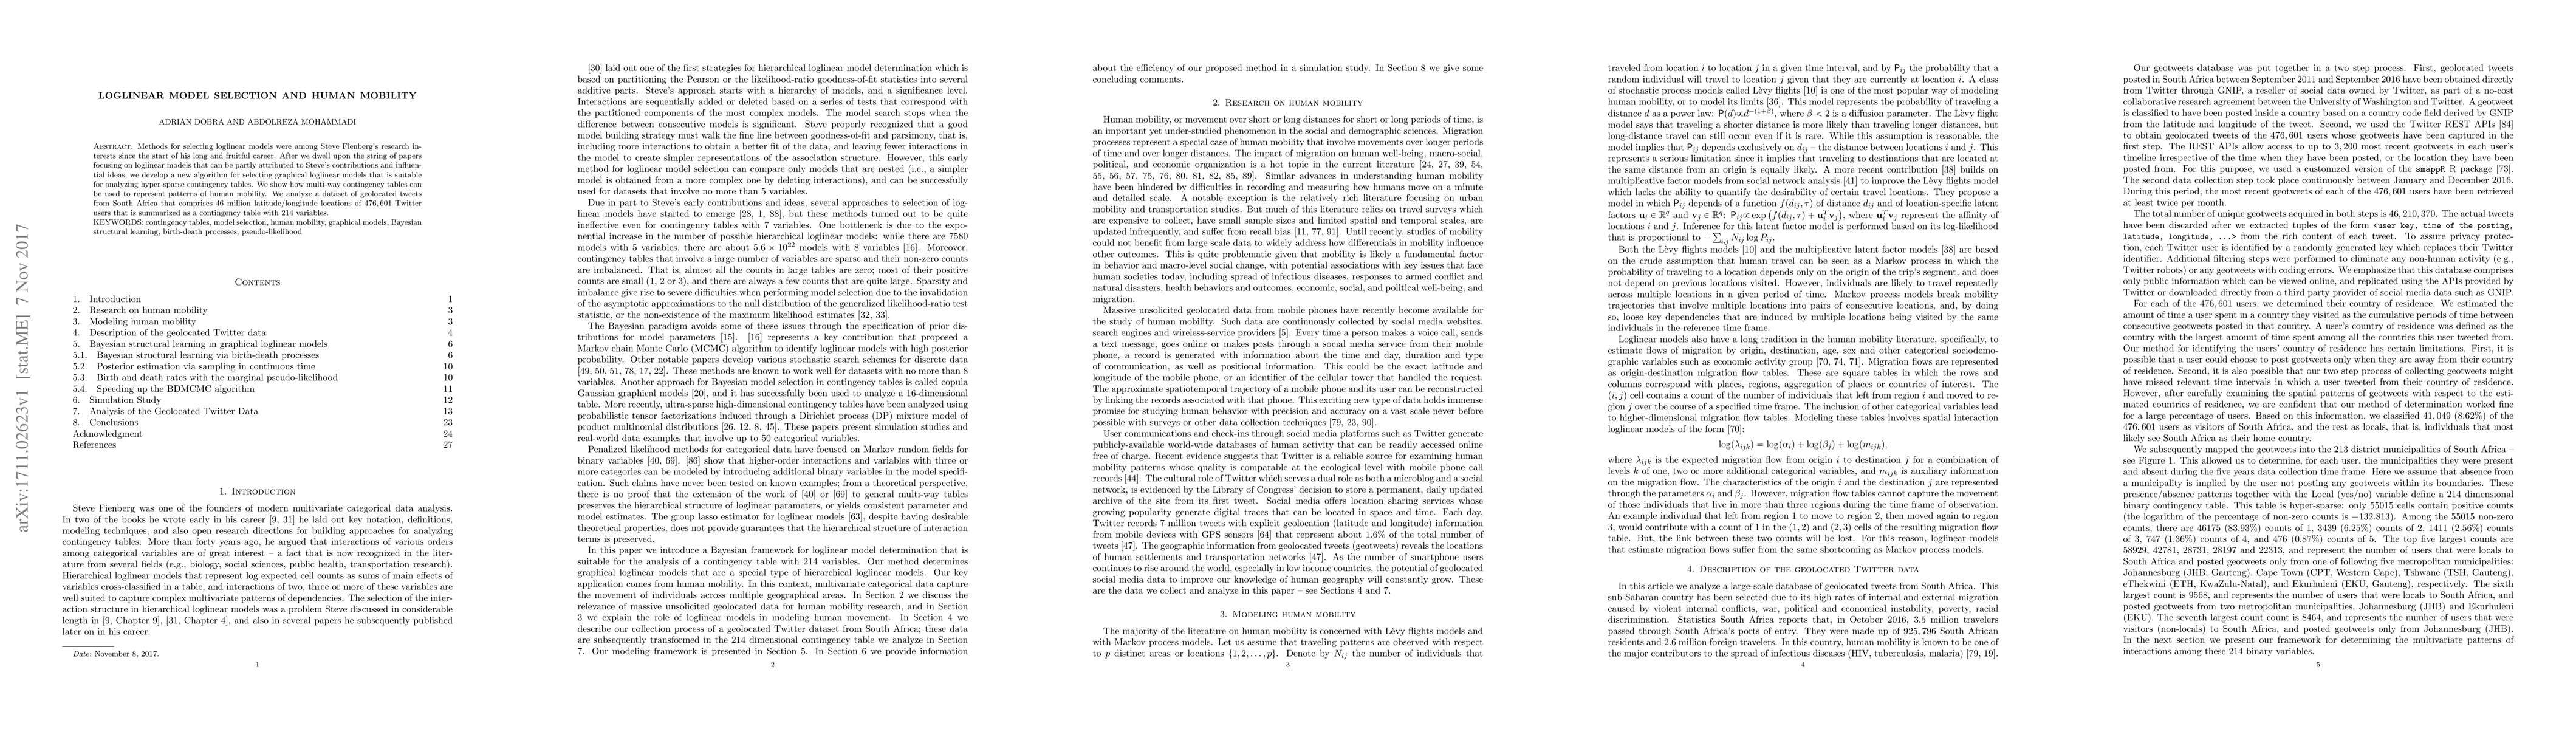
Methods for selecting loglinear models were among Steve Fienberg's research interests since the start of his long and fruitful career. After we dwell upon the string of papers focusing on loglinear models that can be partly attributed to Steve's contributions and influential ideas, we develop a new algorithm for selecting graphical loglinear models that is suitable for analyzing hyper-sparse contingency tables. We show how multi-way contingency tables can be used to represent patterns of human mobility. We analyze a dataset of geolocated tweets from South Africa that comprises 46 million latitude/longitude locations of 476,601 Twitter users that is summarized as a contingency table with 214 variables. KEYWORDS: contingency tables, model selection, human mobility, graphical models, Bayesian structural learning, birth-death processes, pseudo-likelihood
AI Key Findings
Get AI-generated insights about this paper's methodology, results, significance, and more — seven facets brought into focus.
Impact
Paper Details
PDF Preview
Key Terms
Citation Network
Current paper (gray), citations (green), references (blue)
Display is limited for performance on very large graphs.
Discussion 0