Publication
Metrics
Paper Preview
Abstract
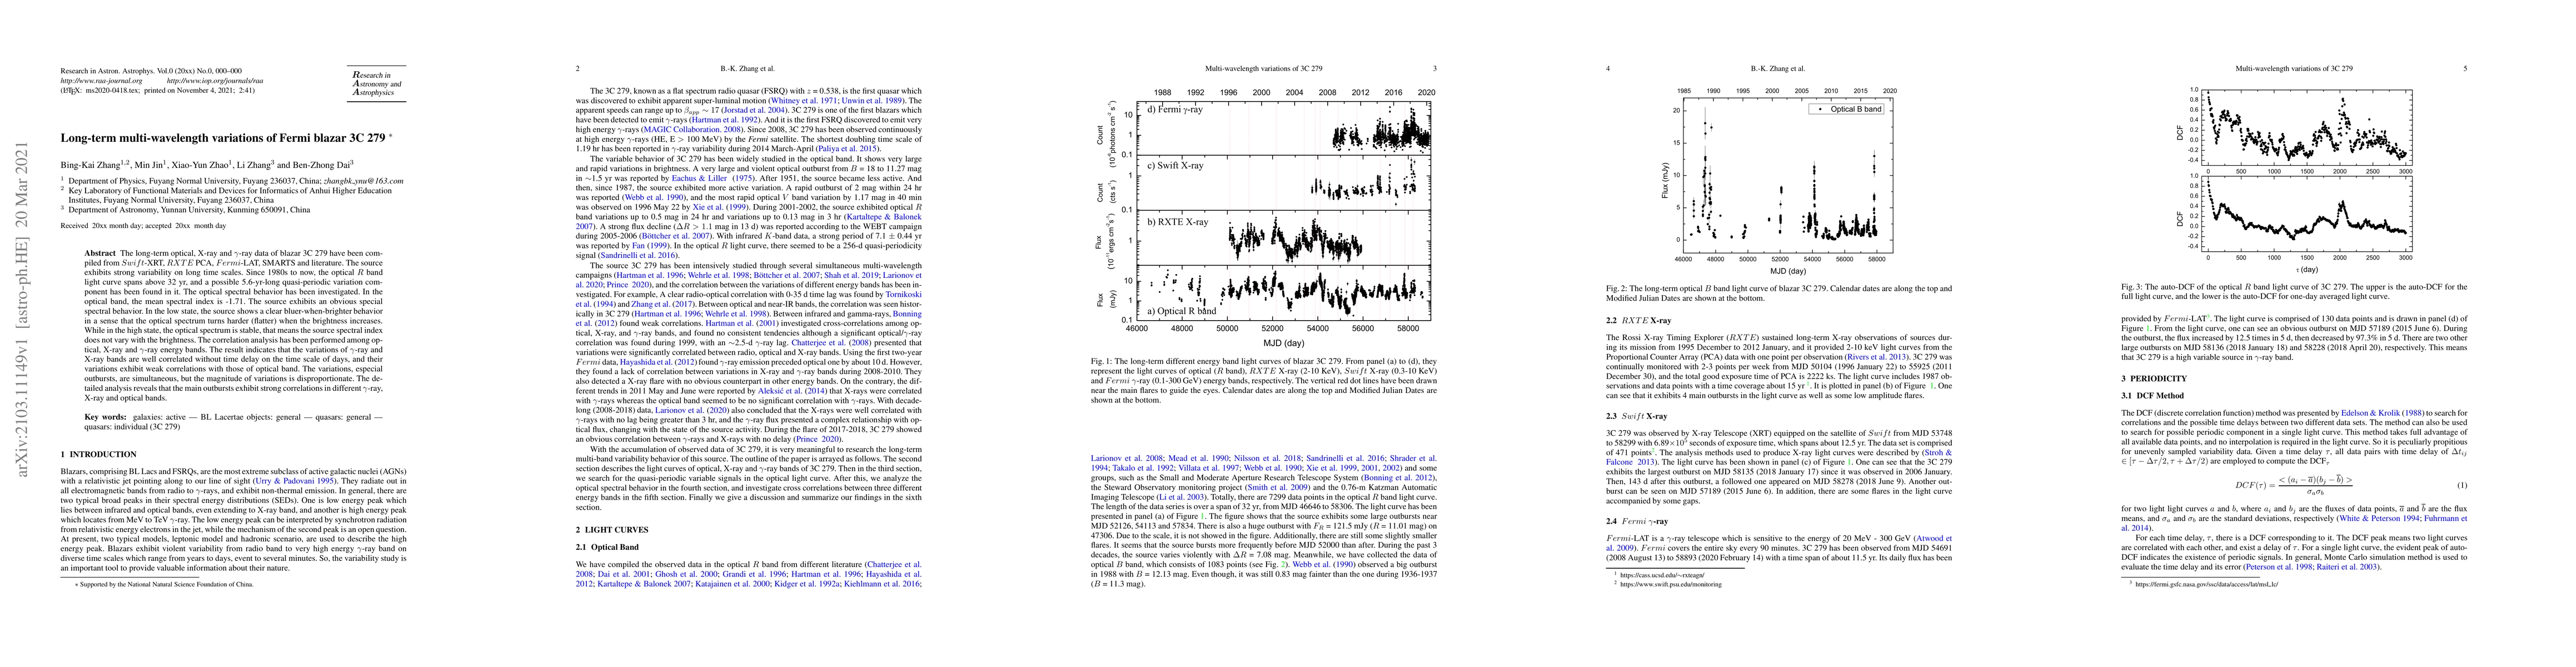
The long-term optical, X-ray and $\gamma$-ray data of blazar 3C 279 have been compiled from $Swift$-XRT, $RXTE$ PCA, $Fermi$-LAT, SMARTS and literature. The source exhibits strong variability on long time scales. Since 1980s to now, the optical $R$ band light curve spans above 32 yr, and a possible 5.6-yr-long quasi-periodic variation component has been found in it. The optical spectral behavior has been investigated. In the optical band, the mean spectral index is -1.71. The source exhibits an obvious special spectral behavior. In the low state, the source shows a clear bluer-when-brighter behavior in a sense that the optical spectrum turns harder (flatter) when the brightness increases. While in the high state, the optical spectrum is stable, that means the source spectral index does not vary with the brightness. The correlation analysis has been performed among optical, X-ray and $\gamma$-ray energy bands. The result indicates that the variations of $\gamma$-ray and X-ray bands are well correlated without time delay on the time scale of days, and their variations exhibit weak correlations with those of optical band. The variations, especial outbursts, are simultaneous, but the magnitude of variations is disproportionate. The detailed analysis reveals that the main outbursts exhibit strong correlations in different $\gamma$-ray, X-ray and optical bands.
AI Key Findings
Get AI-generated insights about this paper's methodology, results, significance, and more — seven facets brought into focus.
Impact
Paper Details
Authors
PDF Preview
Key Terms
Citation Network
Current paper (gray), citations (green), references (blue)
Display is limited for performance on very large graphs.
Discussion 0