Publication
Metrics
AI Quick Summary
This research investigates the long-term optical variability of blazar PKS 2155-304, revealing red noise behavior across various time scales from 20 days to over a decade. Utilizing data from ROTSE-III and ASAS telescopes, it employs a forward folding technique and maximum-likelihood method with Lomb Scargle Periodogram (LSP) and Structure Function (SF). A novel approach, Multiple Fragments Variance Function (MFVF), is also introduced. Results indicate the light curve aligns with a broken power-law Power Spectral Density (PSD), with a power index of β=1.8±0.2 and a break frequency of f_min=(2.7±1.6) yr^-1, confirming the reliability of the methods using simulated light curves.
Paper Preview
Abstract
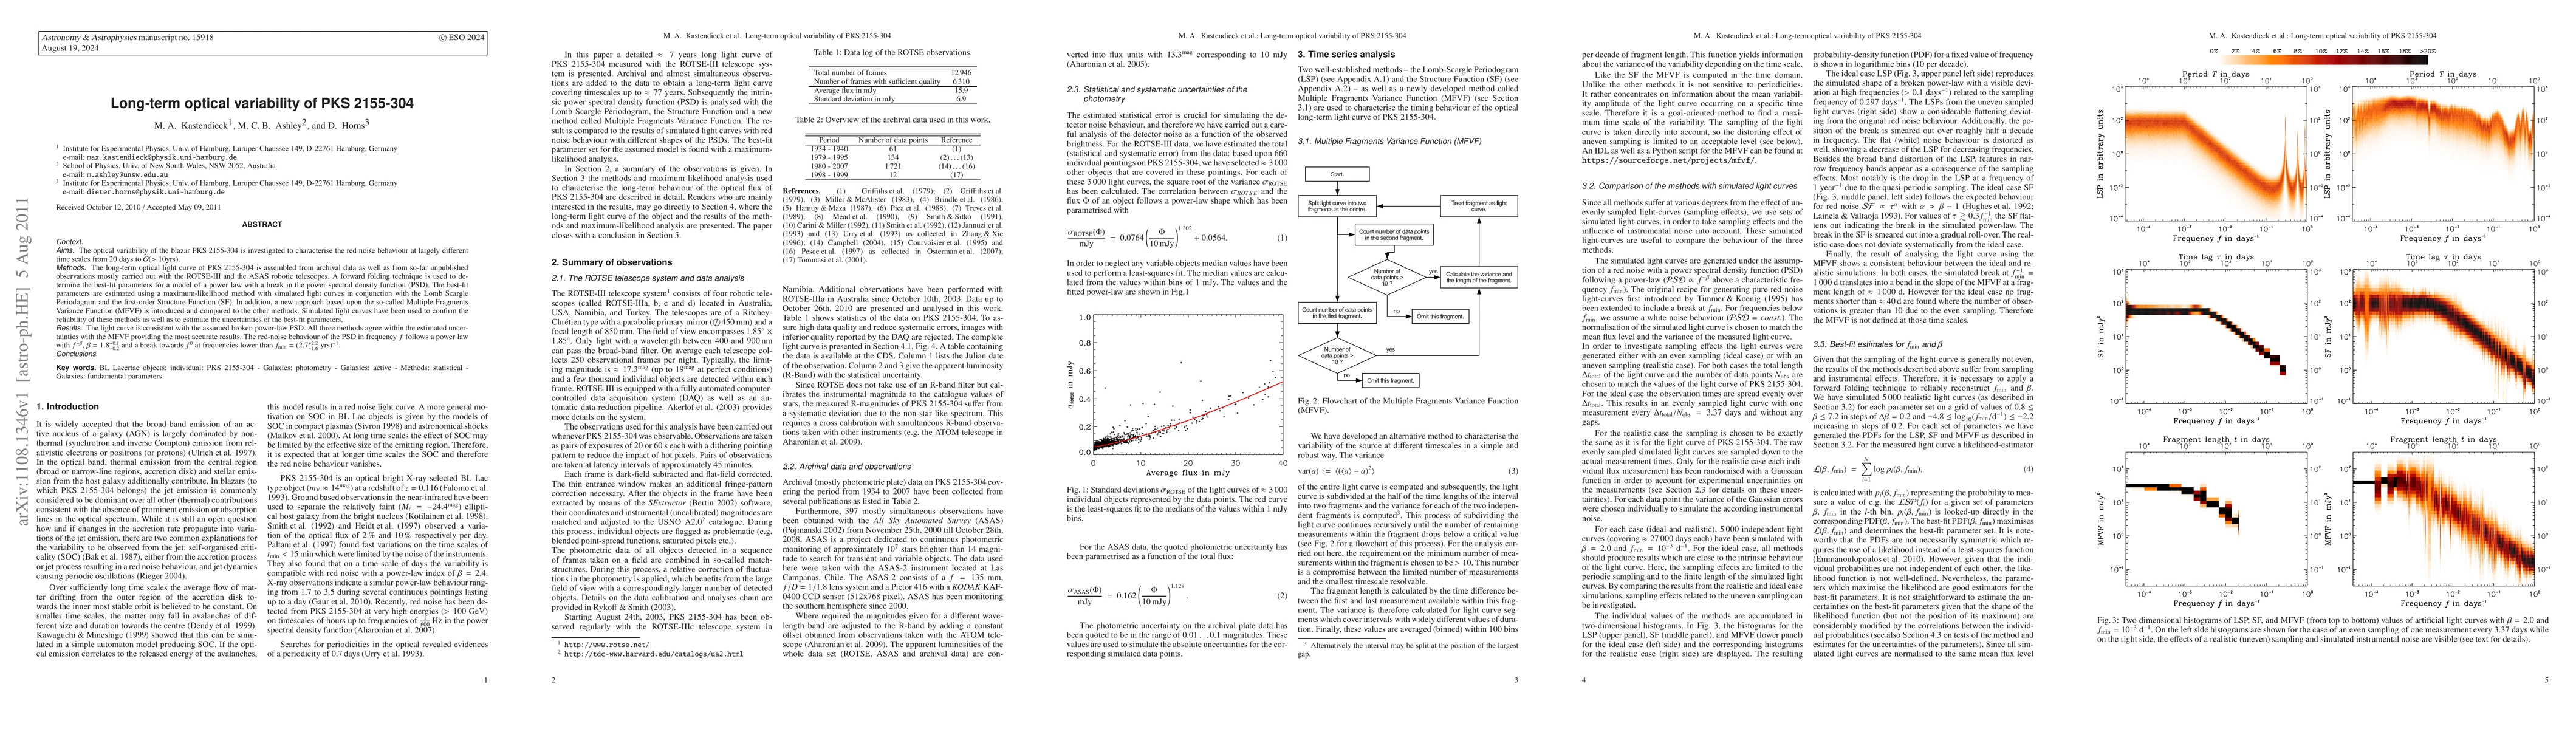
Aims: The optical variability of the blazar PKS 2155-304 is investigated to characterise the red noise behaviour at largely different time scales from 20 days to O(>10 yrs). Methods: The long-term optical light curve of PKS 2155-304 is assembled from archival data as well as from so-far unpublished observations mostly carried out with the ROTSE-III and the ASAS robotic telescopes. A forward folding technique is used to determine the best-fit parameters for a model of a power law with a break in the power spectral density function (PSD). The best-fit parameters are estimated using a maximum-likelihood method with simulated light curves in conjunction with the Lomb Scargle Periodogram (LSP) and the first-order Structure Function (SF). In addition, a new approach based upon the so-called Multiple Fragments Variance Function (MFVF) is introduced and compared to the other methods. Simulated light curves have been used to confirm the reliability of these methods as well as to estimate the uncertainties of the best-fit parameters. Results: The light curve is consistent with the assumed broken power-law PSD. All three methods agree within the estimated uncertainties with the MFVF providing the most accurate results. The red-noise behaviour of the PSD in frequency f follows a power law with f^-{\beta}, {\beta}=1.8 +0.1/-0.2 and a break towards f^0 at frequencies lower than f_min=(2.7 +2.2/-1.6 yrs)^-1.
AI Key Findings
Get AI-generated insights about this paper's methodology, results, significance, and more — seven facets brought into focus.
Impact
Paper Details
PDF Preview
Key Terms
Citation Network
Current paper (gray), citations (green), references (blue)
Display is limited for performance on very large graphs.
Discussion 0