01
MethodologyHow they did it
The AMPT model was used to simulate Au+Au collisions at RHIC energies.
This study investigates longitudinal flow decorrelation in heavy-ion collisions at RHIC energies using the AMPT model, finding stronger decorrelation at lower energies, with $r_{3}$ showing a more pronounced energy dependence. The study highlights that flow plane decorrelation dominates over flow magnitude decorrelation and introduces the four particle cumulant ($T_{2}$) as a resilient observable showing an S-shaped decorrelation pattern across all energies.
This study investigates longitudinal flow decorrelation in heavy-ion collisions at RHIC energies using the AMPT model, finding stronger decorrelation at lower energies, with $r_{3}$ showing a more pronounced energy dependence. The study highlights that flow plane decorrelation dominates over flow magnitude decorrelation and introduces the four particle cumulant ($T_{2}$) as a resilient observable showing an S-shaped decorrelation pattern across all energies.
The AMPT model was used to simulate Au+Au collisions at RHIC energies. More in Methodology →
r2 > r3 in 0-10% centrality — T2 is consistent with zero in 0-10% and 10-40% centralities More in Key Results →
This study provides new insights into the longitudinal flow decorrelation parameters in heavy-ion collisions. More in Significance →
Limited statistics in 40-80% centrality — Assumes a specific model for hadronic interactions More in Limitations →
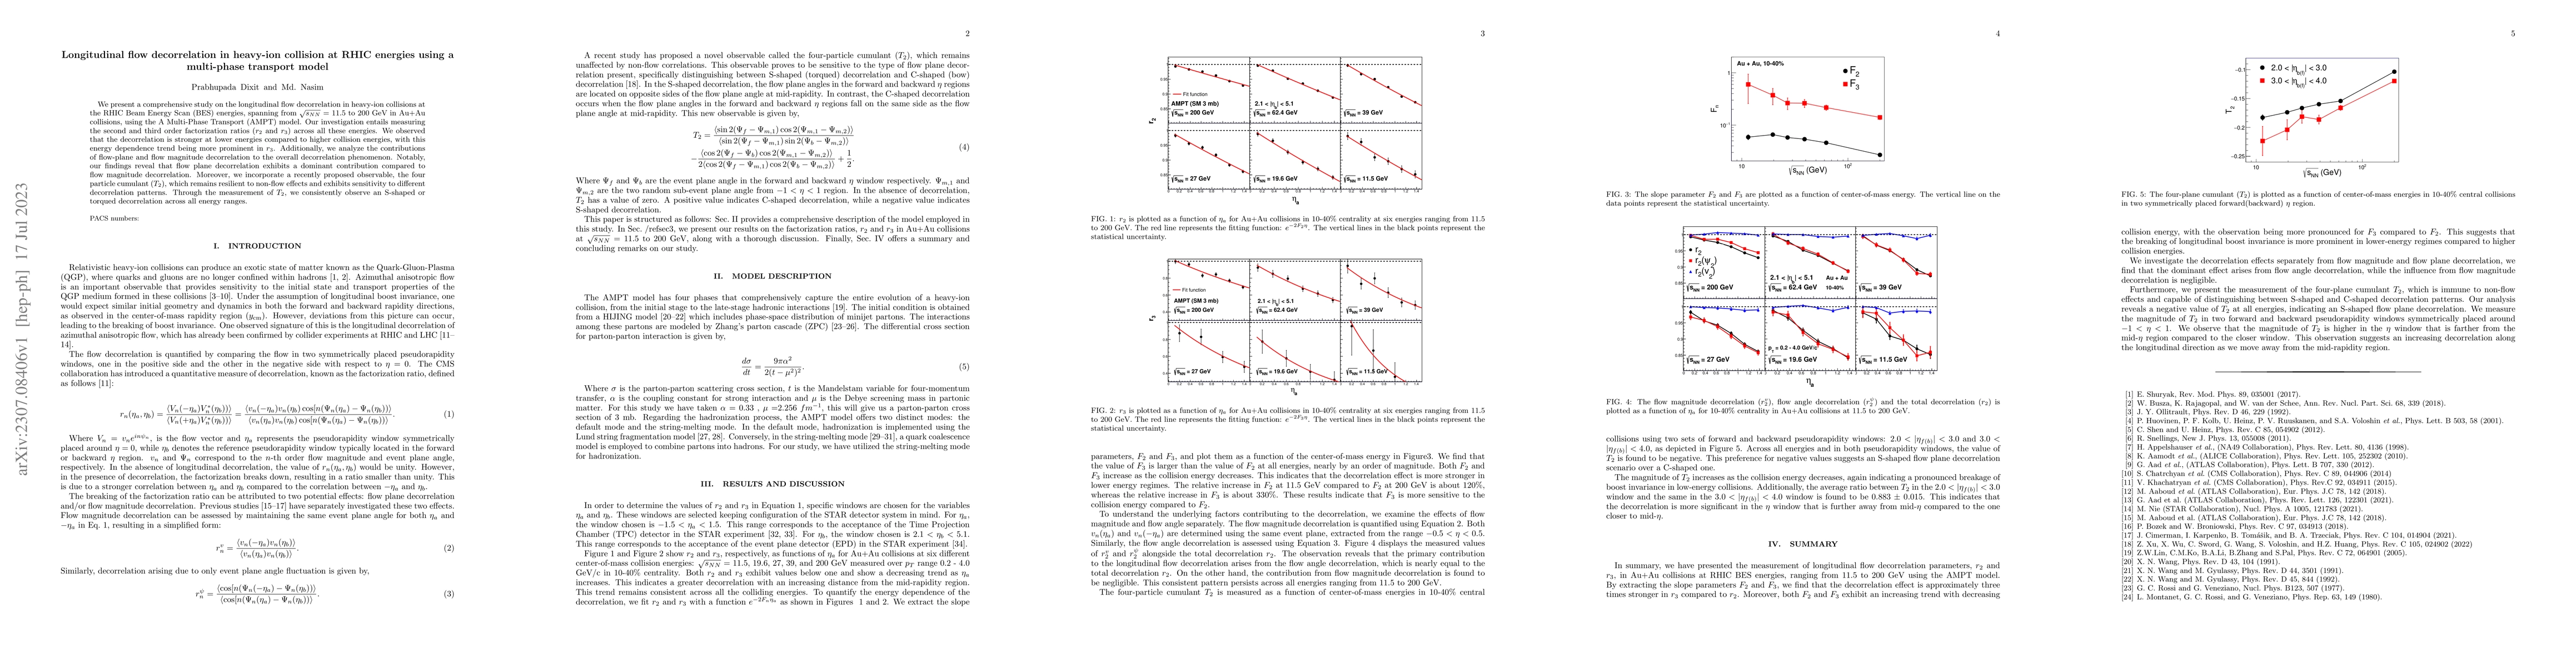
We present a comprehensive study on the longitudinal flow decorrelation in heavy-ion collisions at the RHIC Beam Energy Scan (BES) energies, spanning from $\sqrt{s_{NN}}$ = 11.5 to 200 GeV in Au+Au collisions, using the A Multi-Phase Transport (AMPT) model. Our investigation entails measuring the second and third order factorization ratios ($r_{2}$ and $r_{3}$) across all these energies. We observed that the decorrelation is stronger at lower energies compared to higher collision energies, with this energy dependence trend being more prominent in $r_{3}$. Additionally, we analyze the contributions of flow-plane and flow magnitude decorrelation to the overall decorrelation phenomenon. Notably, our findings reveal that flow plane decorrelation exhibits a dominant contribution compared to flow magnitude decorrelation. Moreover, we incorporate a recently proposed observable, the four particle cumulant ($T_{2}$), which remains resilient to non-flow effects and exhibits sensitivity to different decorrelation patterns. Through the measurement of $T_{2}$, we consistently observe an S-shaped or torqued decorrelation across all energy ranges.
Seven facets of this paper, analysed and brought into focus by AI.
This study provides new insights into the longitudinal flow decorrelation parameters in heavy-ion collisions.
The AMPT model was used to simulate Au+Au collisions at RHIC energies.
This study provides new insights into the longitudinal flow decorrelation parameters in heavy-ion collisions.
The AMPT model was used to simulate Au+Au collisions at RHIC energies.
This study presents new measurements of longitudinal flow decorrelation parameters in heavy-ion collisions
Current paper (gray), citations (green), references (blue)
Display is limited for performance on very large graphs.
Discussion 0