LookOut on Time-Evolving Graphs: Succinctly Explaining Anomalies from Any Detector
Publication
Metrics
AI Quick Summary
A new algorithm called LookOut provides clear explanations of anomalies in time-evolving graphs, helping human analysts understand why a node is marked as anomalous, without requiring extensive domain knowledge.
Paper Preview
Abstract
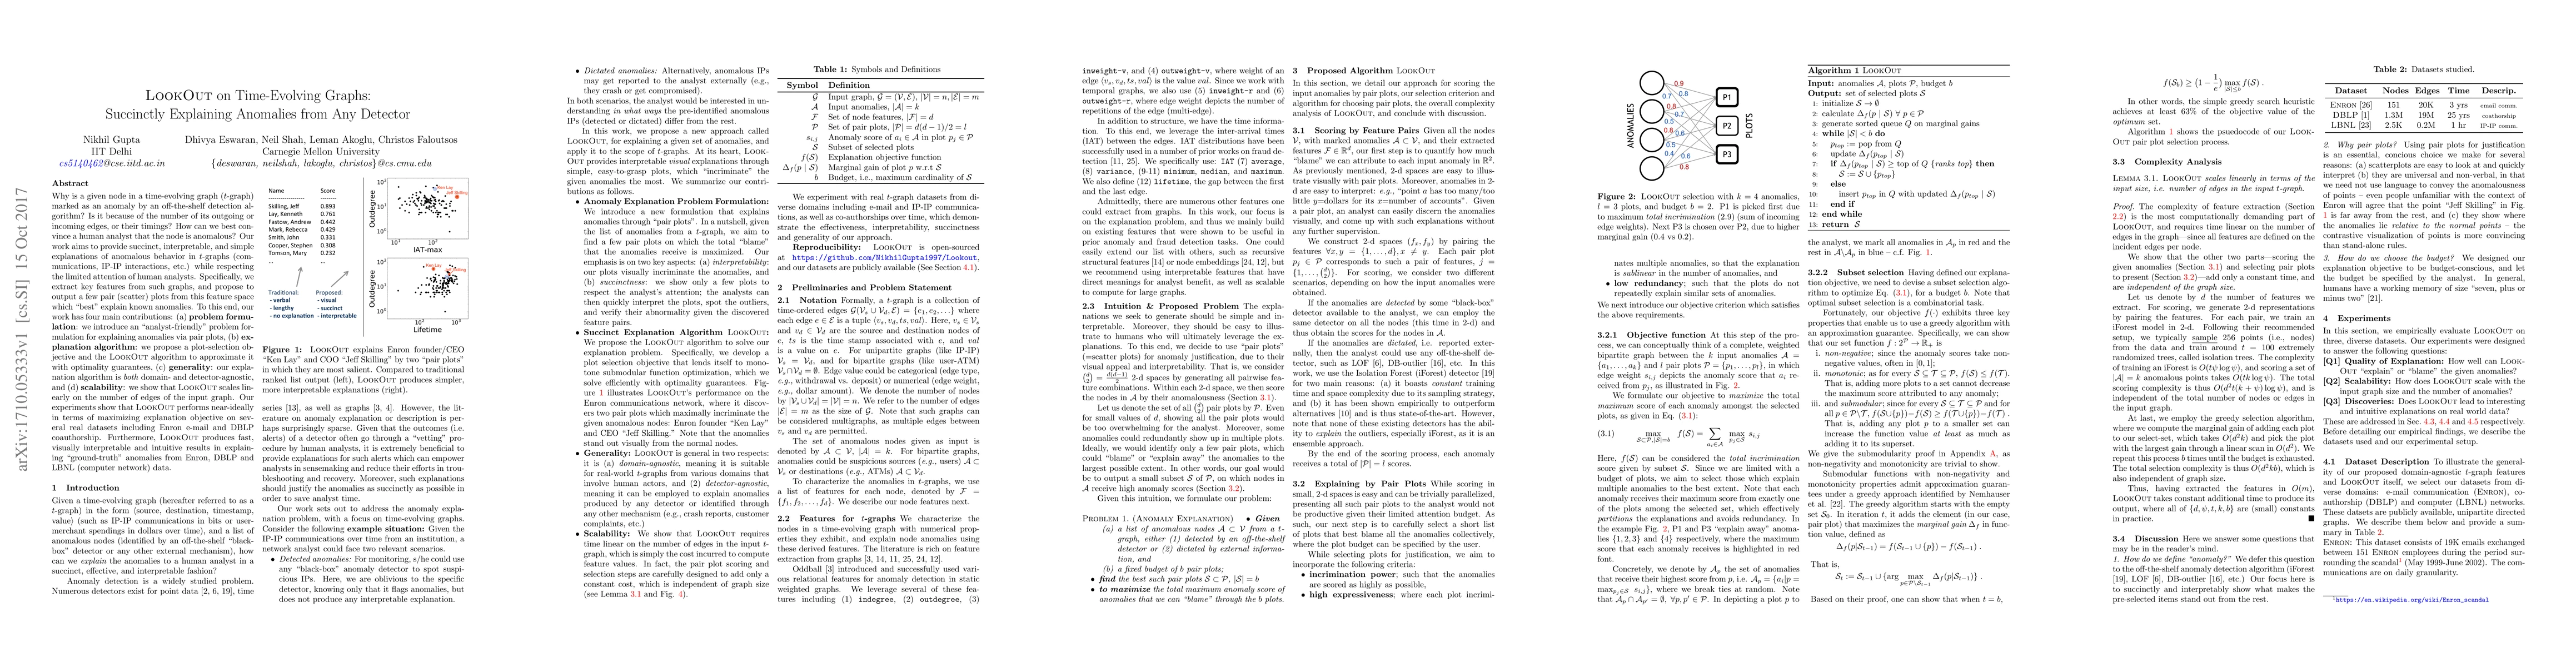
Why is a given node in a time-evolving graph ($t$-graph) marked as an anomaly by an off-the-shelf detection algorithm? Is it because of the number of its outgoing or incoming edges, or their timings? How can we best convince a human analyst that the node is anomalous? Our work aims to provide succinct, interpretable, and simple explanations of anomalous behavior in $t$-graphs (communications, IP-IP interactions, etc.) while respecting the limited attention of human analysts. Specifically, we extract key features from such graphs, and propose to output a few pair (scatter) plots from this feature space which "best" explain known anomalies. To this end, our work has four main contributions: (a) problem formulation: we introduce an "analyst-friendly" problem formulation for explaining anomalies via pair plots, (b) explanation algorithm: we propose a plot-selection objective and the LookOut algorithm to approximate it with optimality guarantees, (c) generality: our explanation algorithm is both domain- and detector-agnostic, and (d) scalability: we show that LookOut scales linearly on the number of edges of the input graph. Our experiments show that LookOut performs near-ideally in terms of maximizing explanation objective on several real datasets including Enron e-mail and DBLP coauthorship. Furthermore, LookOut produces fast, visually interpretable and intuitive results in explaining "ground-truth" anomalies from Enron, DBLP and LBNL (computer network) data.
AI Key Findings
Get AI-generated insights about this paper's methodology, results, significance, and more — seven facets brought into focus.
Impact
Paper Details
PDF Preview
Key Terms
Citation Network
Current paper (gray), citations (green), references (blue)
Display is limited for performance on very large graphs.
Discussion 0