Summary
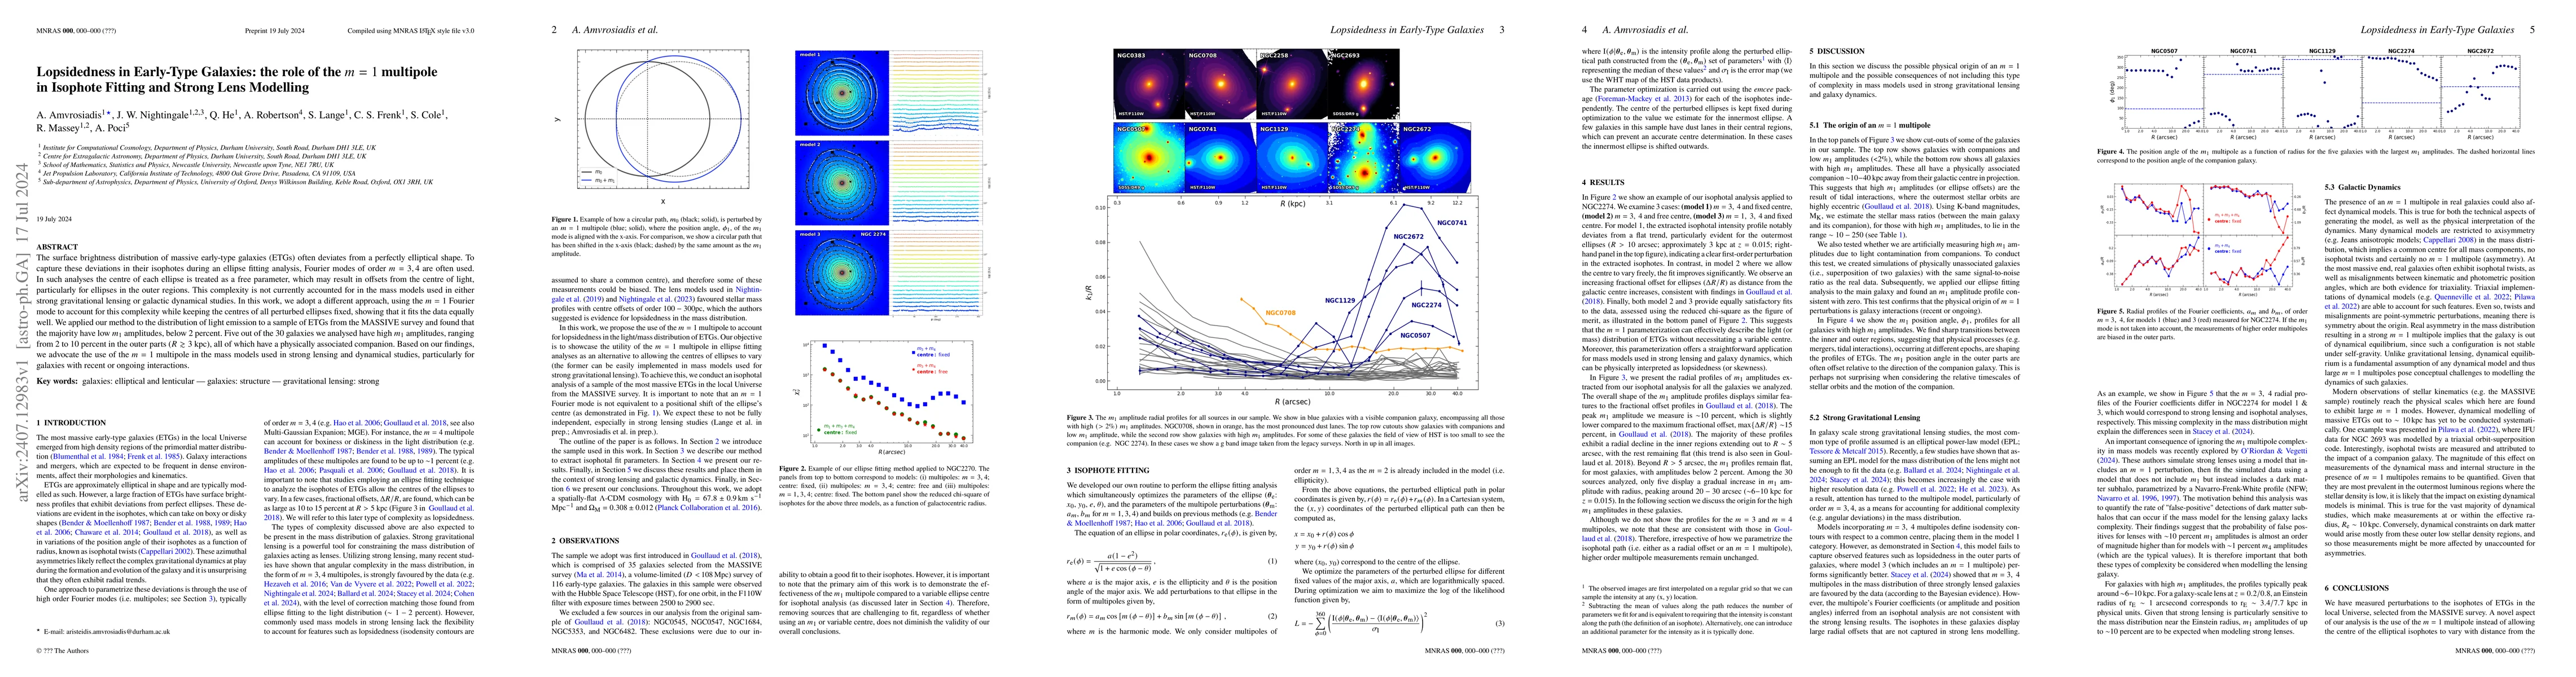
The surface brightness distribution of massive early-type galaxies (ETGs) often deviates from a perfectly elliptical shape. To capture these deviations in their isophotes during an ellipse fitting analysis, Fourier modes of order $m = 3, 4$ are often used. In such analyses the centre of each ellipse is treated as a free parameter, which may result in offsets from the centre of light, particularly for ellipses in the outer regions. This complexity is not currently accounted for in the mass models used in either strong gravitational lensing or galactic dynamical studies. In this work, we adopt a different approach, using the $m=1$ Fourier mode to account for this complexity while keeping the centres of all perturbed ellipses fixed, showing that it fits the data equally well. We applied our method to the distribution of light emission to a sample of ETGs from the MASSIVE survey and found that the majority have low $m_1$ amplitudes, below 2 percent. Five out of the 30 galaxies we analysed have high $m_1$ amplitudes, ranging from 2 to 10 percent in the outer parts ($R \gtrsim 3$ kpc), all of which have a physically associated companion. Based on our findings, we advocate the use of the $m=1$ multipole in the mass models used in strong lensing and dynamical studies, particularly for galaxies with recent or ongoing interactions.
AI Key Findings
Get AI-generated insights about this paper's methodology, results, and significance.
Paper Details
PDF Preview
Citation Network
Current paper (gray), citations (green), references (blue)
Display is limited for performance on very large graphs.
Similar Papers
Found 4 papersNo citations found for this paper.
Comments (0)