Publication
Metrics
AI Quick Summary
This study uses synchrotron x-ray diffraction to reveal two-step structural and magnetic phase transitions in Fe1+yTe near a tricitical point, showing sluggish transitions due to competition between orthorhombic and monoclinic phases. The research integrates diffraction data with specific heat, resistivity, and magnetization measurements to revise the temperature-composition phase diagram.
Paper Preview
Abstract
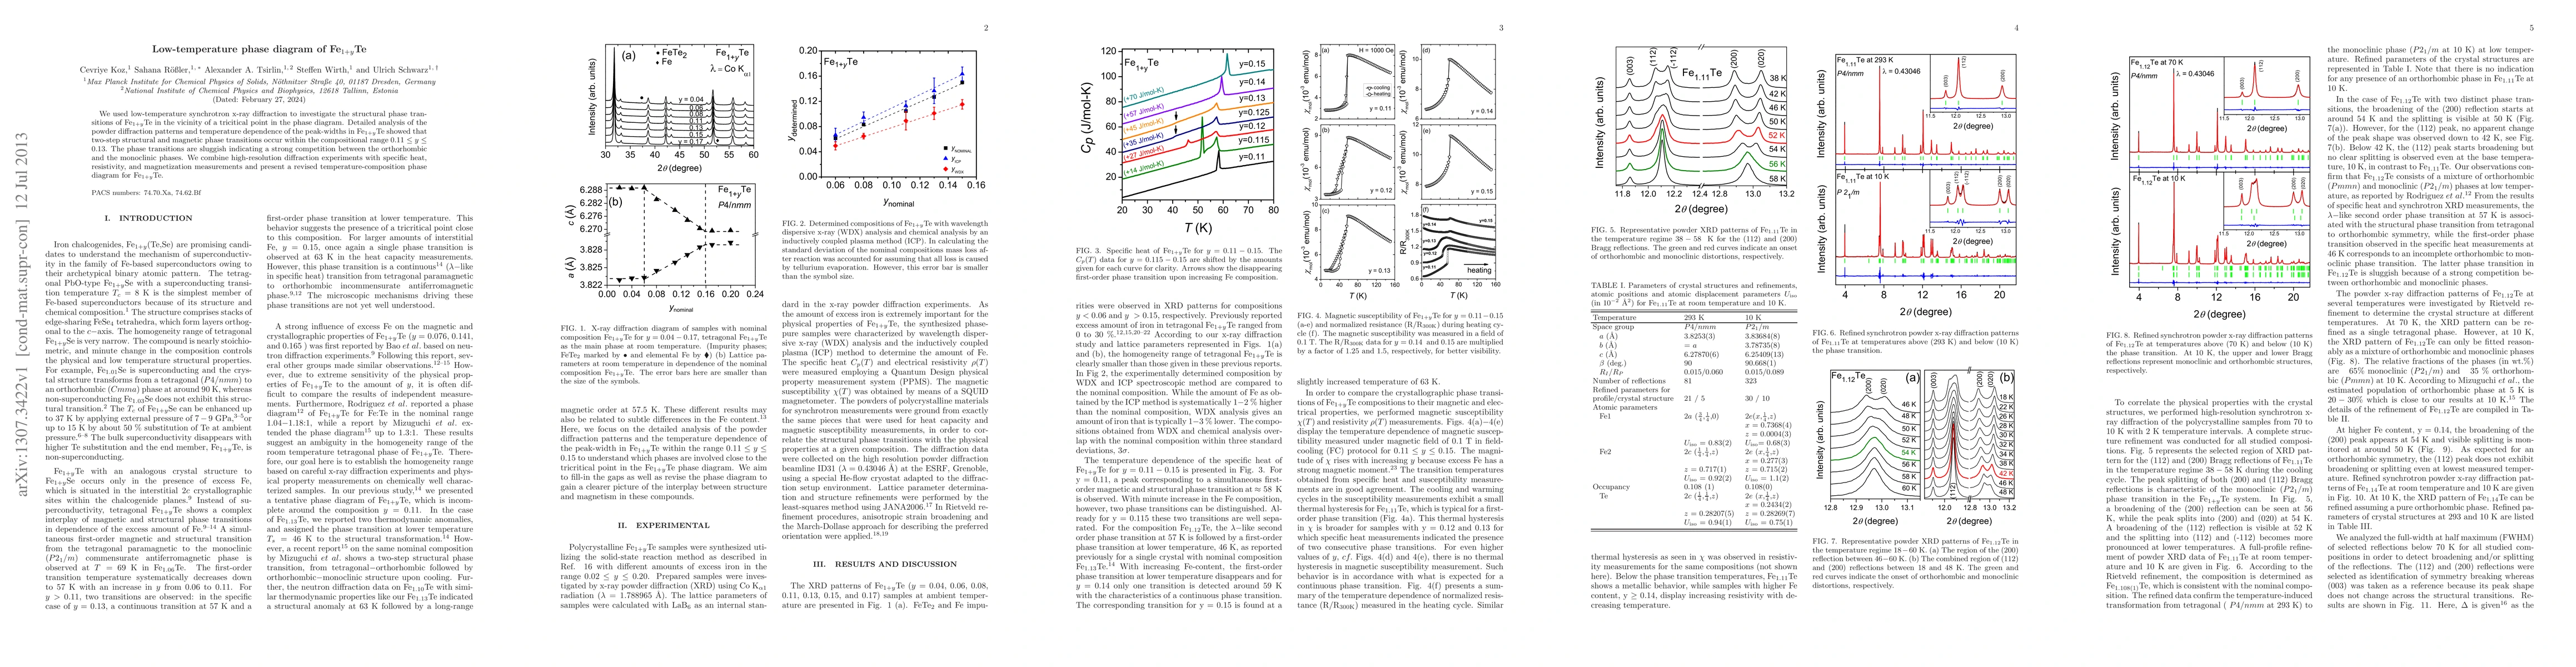
We used low-temperature synchrotron x-ray diffraction to investigate the structural phase transitions of Fe1+yTe in the vicinity of a tricitical point in the phase diagram. Detailed analysis of the powder diffraction patterns and temperature dependence of the peak-widths in Fe1+yTe showed that two-step structural and magnetic phase transitions occur within the compositional range 0.11 $\leq y \leq $ 0.13. The phase transitions are sluggish indicating a strong competition between the orthorhombic and the monoclinic phases. We combine high-resolution diffraction experiments with specific heat, resistivity, and magnetization measurements and present a revised temperature-composition phase diagram for Fe1+yTe.
AI Key Findings
Get AI-generated insights about this paper's methodology, results, significance, and more — seven facets brought into focus.
Impact
Paper Details
PDF Preview
Key Terms
Citation Network
Current paper (gray), citations (green), references (blue)
Display is limited for performance on very large graphs.
Discussion 0