Lower bounds for the trade-off between bias and mean absolute deviation
Publication
Metrics
AI Quick Summary
This paper establishes a lower bound for the trade-off between bias and mean absolute deviation in nonparametric estimation within the Gaussian white noise model, showing that any estimator with sufficiently low worst-case bias must also have a correspondingly large worst-case mean absolute deviation. The result relies on abstract inequalities linking expectation changes across probability measures to mean absolute deviation.
Paper Preview
Abstract
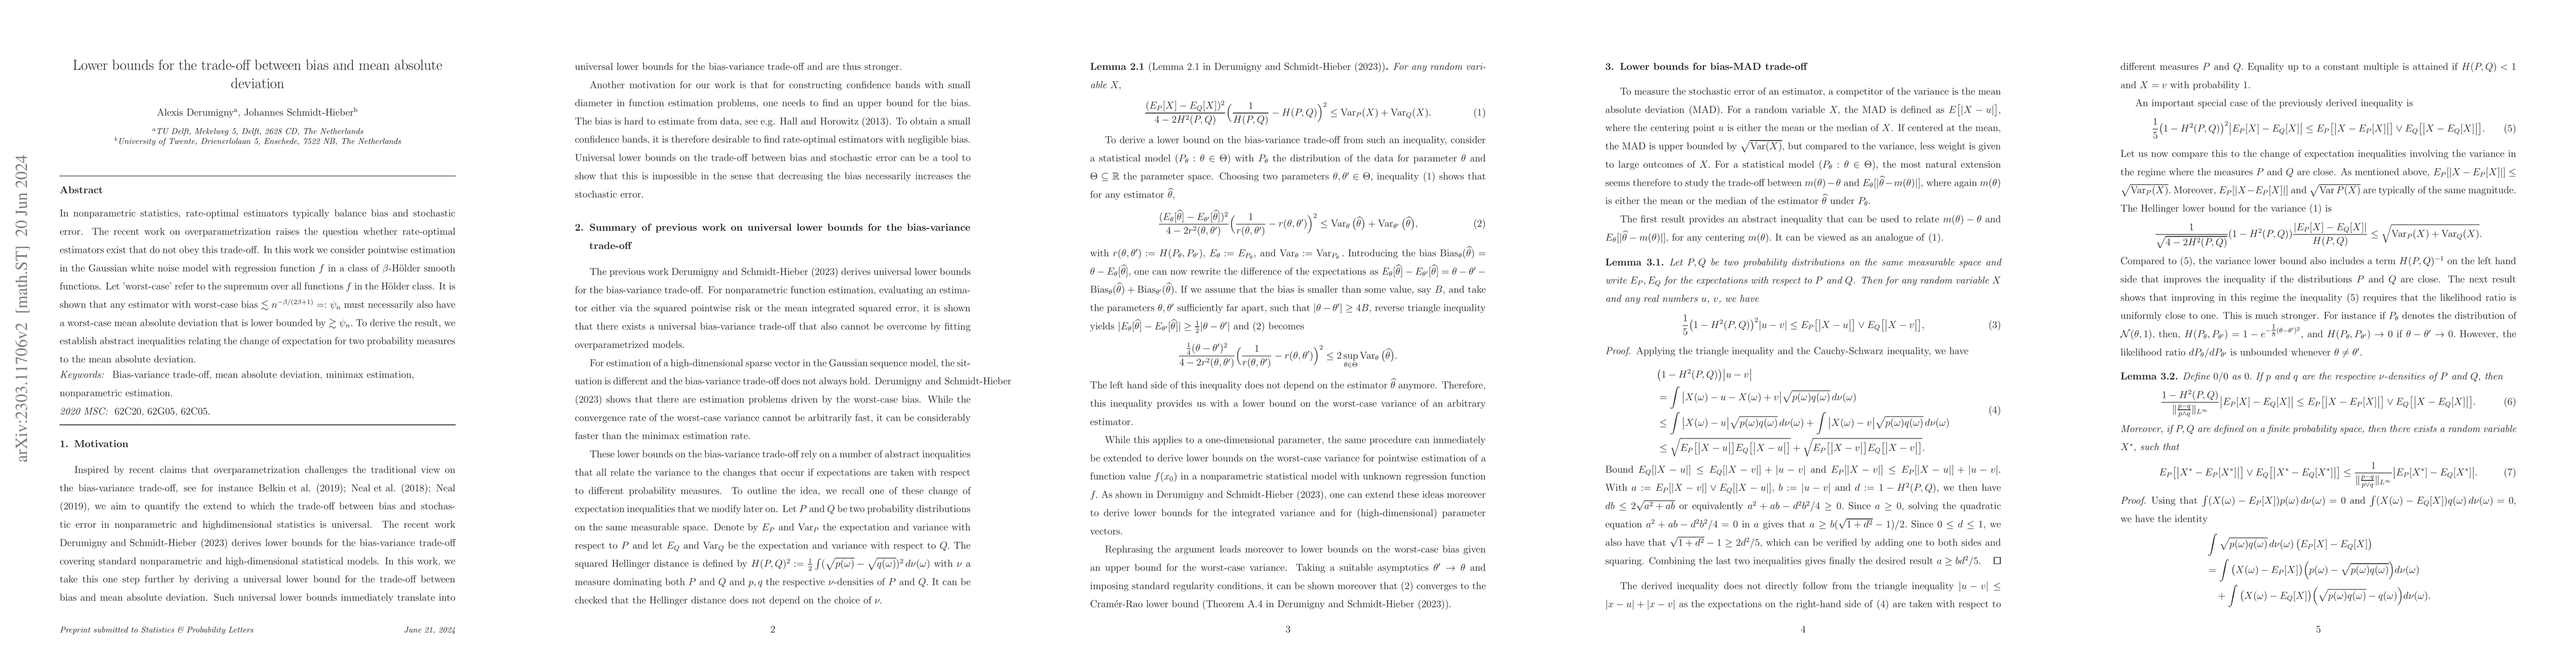
In nonparametric statistics, rate-optimal estimators typically balance bias and stochastic error. The recent work on overparametrization raises the question whether rate-optimal estimators exist that do not obey this trade-off. In this work we consider pointwise estimation in the Gaussian white noise model with regression function $f$ in a class of $\beta$-H\"older smooth functions. Let 'worst-case' refer to the supremum over all functions $f$ in the H\"older class. It is shown that any estimator with worst-case bias $\lesssim n^{-\beta/(2\beta+1)}=: \psi_n$ must necessarily also have a worst-case mean absolute deviation that is lower bounded by $\gtrsim \psi_n.$ To derive the result, we establish abstract inequalities relating the change of expectation for two probability measures to the mean absolute deviation.
AI Key Findings
Get AI-generated insights about this paper's methodology, results, significance, and more — seven facets brought into focus.
Impact
Paper Details
Authors
PDF Preview
Key Terms
Citation Network
Current paper (gray), citations (green), references (blue)
Display is limited for performance on very large graphs.
Discussion 0