Luminous Red Nova AT 2019zhd, a new merger in M 31
Publication
Metrics
Paper Preview
Abstract
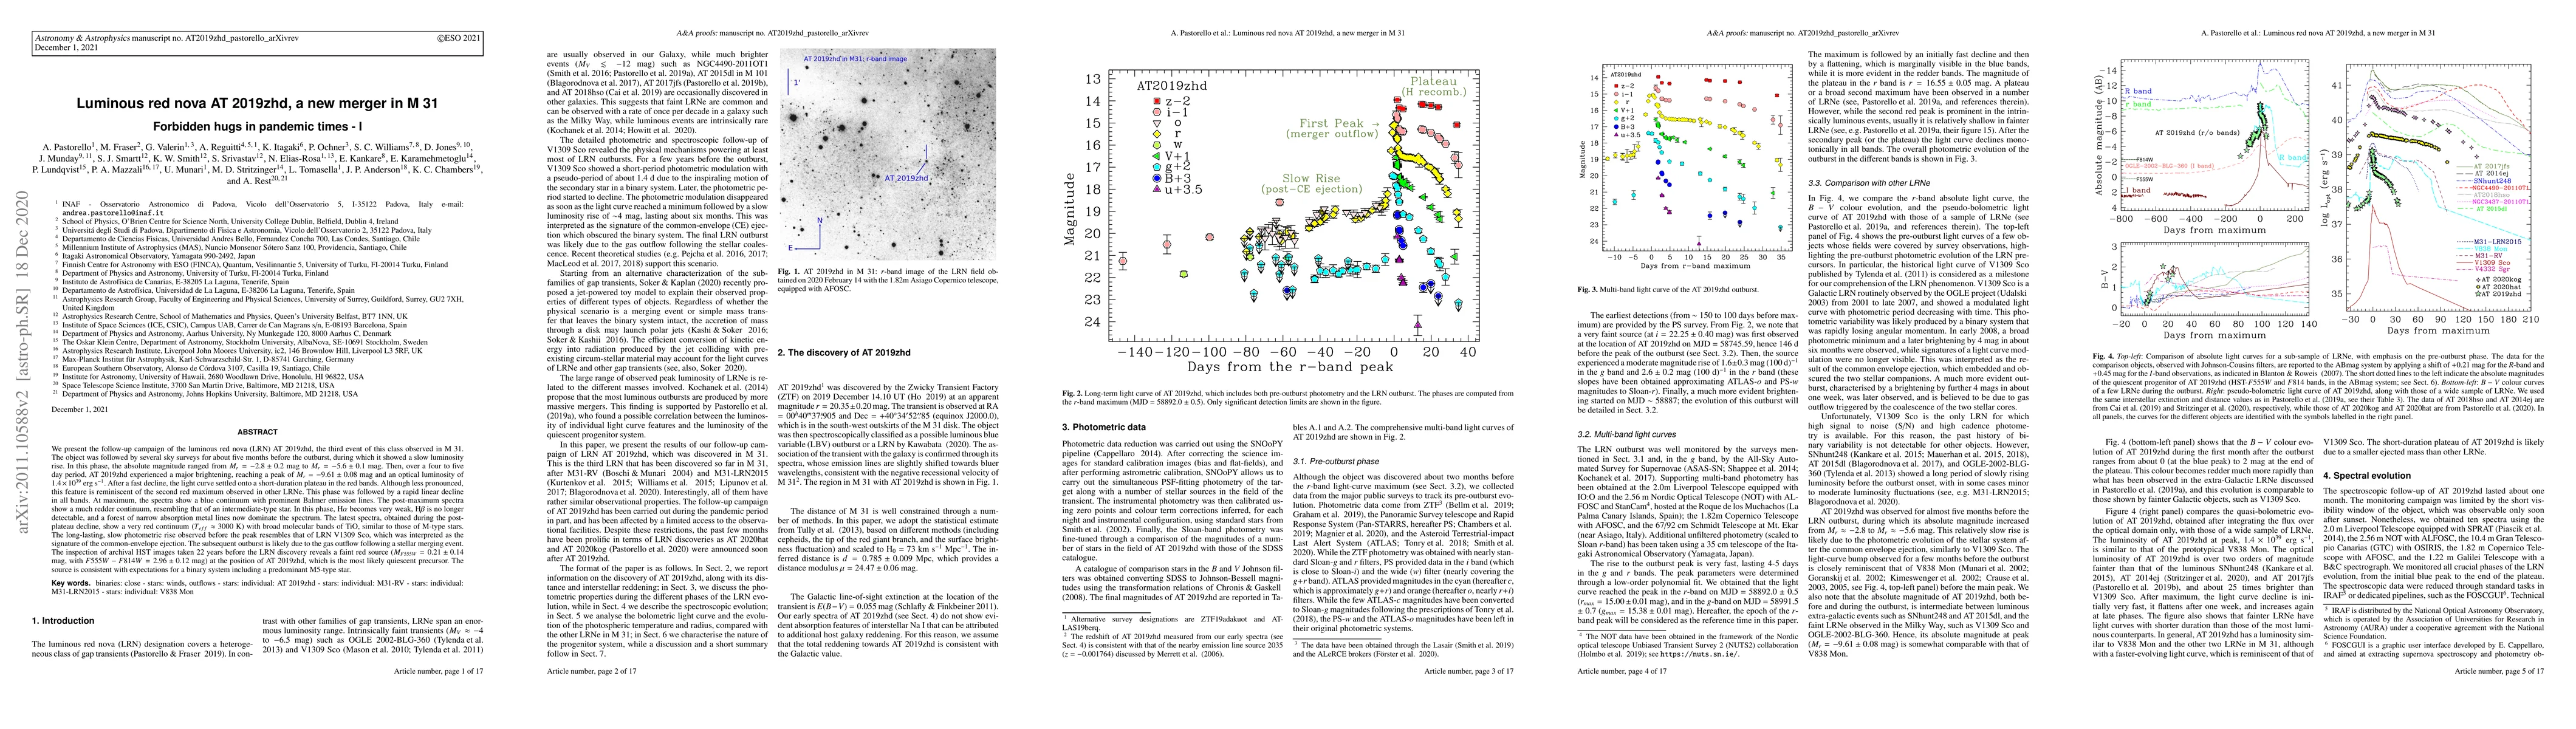
We present the follow-up campaign of the luminous red nova (LRN) AT~2019zhd, the third event of this class observed in M 31. The object was followed by several sky surveys for about five months before the outburst, during which it showed a slow luminosity rise. In this phase, the absolute magnitude ranged from M_r=-2.8+-0.2 mag to M_r=-5.6+-0.1 mag. Then, over a four-five day period, AT 2019zhd experienced a major brightening, reaching at peak M_r=-9.61+-0.08 mag, and an optical luminosity of 1.4x10^39 erg/s. After a fast decline, the light curve settled onto a short-duration plateau in the red bands. Although less pronounced, this feature is reminiscent of the second red maximum observed in other LRNe. This phase was followed by a rapid linear decline in all bands. At maximum, the spectra show a blue continuum with prominent Balmer emission lines. The post-maximum spectra show a much redder continuum, resembling that of an intermediate-type star. In this phase, Halpha becomes very weak, Hbeta is no longer detectable and a forest of narrow absorption metal lines now dominate the spectrum. The latest spectra, obtained during the post-plateau decline, show a very red continuum (T_eff ~ 3000 K) with broad molecular bands of TiO, similar to those of M-type stars. The long-lasting, slow photometric rise observed before the peak resembles that of LRN V1309 Sco, which was interpreted as the signature of the common-envelope ejection. The subsequent outburst is likely due to the gas outflow following a stellar merging event. The inspection of archival HST images taken 22 years before the LRN discovery reveals a faint red source (M_F555W=0.21+-0.14 mag, with F555W-F814W = 2.96+-0.12 mag) at the position of AT 2019zhd, which is the most likely quiescent precursor. The source is consistent with expectations for a binary system including a predominant M5-type star.
AI Key Findings
Get AI-generated insights about this paper's methodology, results, significance, and more — seven facets brought into focus.
Impact
Paper Details
Authors
PDF Preview
Key Terms
Citation Network
Current paper (gray), citations (green), references (blue)
Display is limited for performance on very large graphs.
Discussion 0