Machine-learning the phase diagram of a strongly-interacting Fermi gas
Publication
Metrics
AI Quick Summary
This paper uses an artificial neural network to map the phase diagram of strongly interacting fermions transitioning from BEC to BCS states, revealing a maximum critical temperature on the bosonic side. The neural network interprets the momentum distribution, traditionally seen as featureless, to provide insights into the condensed state.
Paper Preview
Abstract
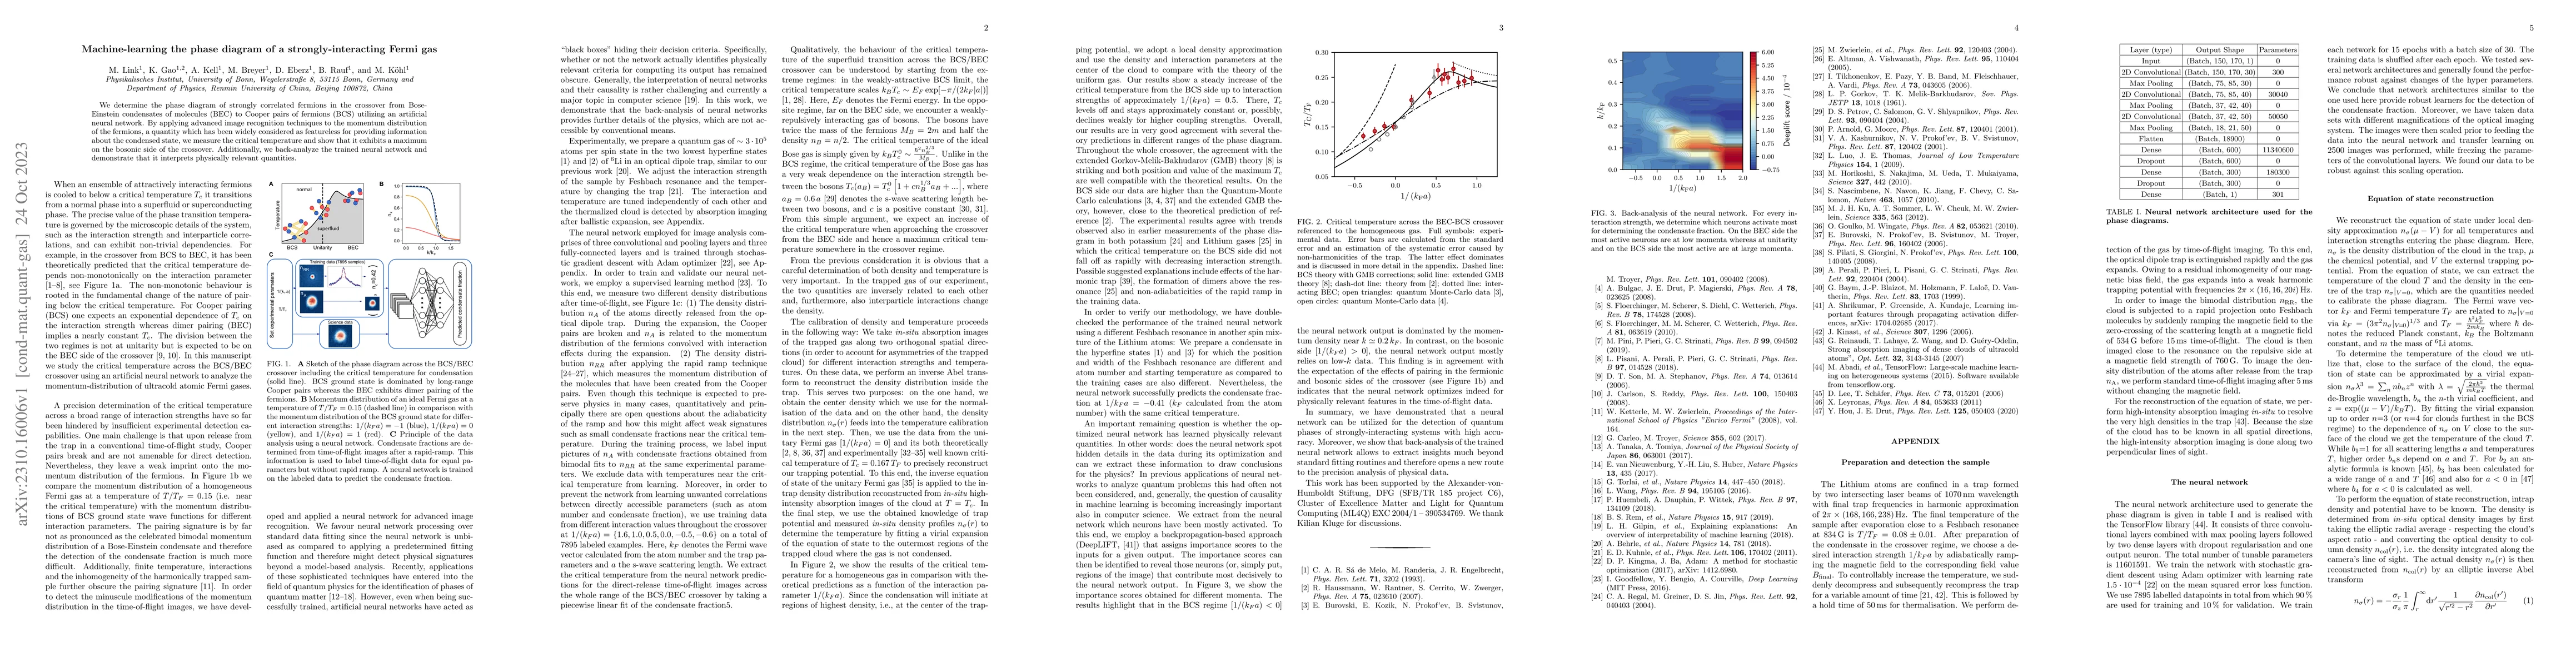
We determine the phase diagram of strongly correlated fermions in the crossover from Bose-Einstein condensates of molecules (BEC) to Cooper pairs of fermions (BCS) utilizing an artificial neural network. By applying advanced image recognition techniques to the momentum distribution of the fermions, a quantity which has been widely considered as featureless for providing information about the condensed state, we measure the critical temperature and show that it exhibits a maximum on the bosonic side of the crossover. Additionally, we back-analyze the trained neural network and demonstrate that it interprets physically relevant quantities.
AI Key Findings
Get AI-generated insights about this paper's methodology, results, significance, and more — seven facets brought into focus.
Impact
Paper Details
Authors
PDF Preview
Key Terms
Citation Network
Current paper (gray), citations (green), references (blue)
Display is limited for performance on very large graphs.
Discussion 0