Macroscopic Manifestations of Traffic Waves in Microscopic Models
Publication
Metrics
AI Quick Summary
This paper investigates how traffic waves emerge from single-lane car-following behavior using microscopic models. It establishes a method to generate macroscopic traffic flow quantities from these models, providing insights into the cause-to-effect relationships of observed traffic patterns and the shapes of reduced fundamental diagrams for various microscopic models.
Paper Preview
Abstract
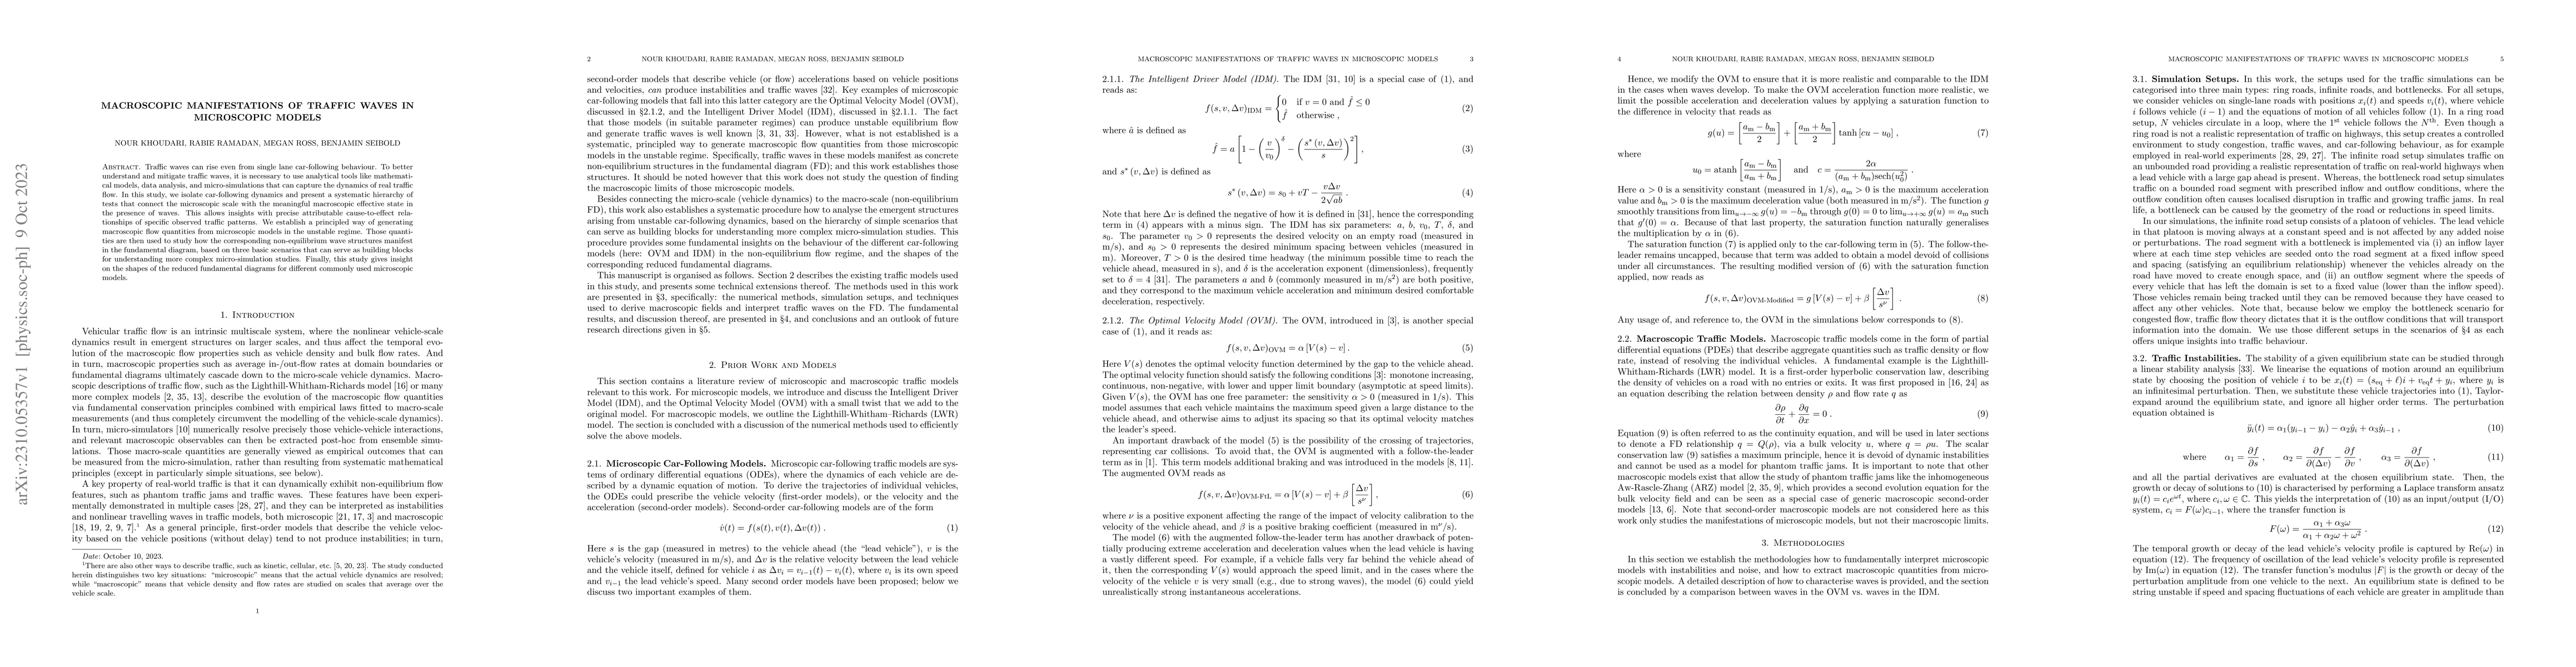
Traffic waves can rise even from single lane car-following behaviour. To better understand and mitigate traffic waves, it is necessary to use analytical tools like mathematical models, data analysis, and micro-simulations that can capture the dynamics of real traffic flow. In this study, we isolate car-following dynamics and present a systematic hierarchy of tests that connect the microscopic scale with the meaningful macroscopic effective state in the presence of waves. This allows insights with precise attributable cause-to-effect relationships of specific observed traffic patterns. We establish a principled way of generating macroscopic flow quantities from microscopic models in the unstable regime. Those quantities are then used to study how the corresponding non-equilibrium wave structures manifest in the fundamental diagram, based on three basic scenarios that can serve as building blocks for understanding more complex micro-simulation studies. Finally, this study gives insight on the shapes of the reduced fundamental diagrams for different commonly used microscopic models.
AI Key Findings
Get AI-generated insights about this paper's methodology, results, significance, and more — seven facets brought into focus.
Impact
Paper Details
Authors
PDF Preview
Key Terms
Citation Network
Current paper (gray), citations (green), references (blue)
Display is limited for performance on very large graphs.
Discussion 0