Summary
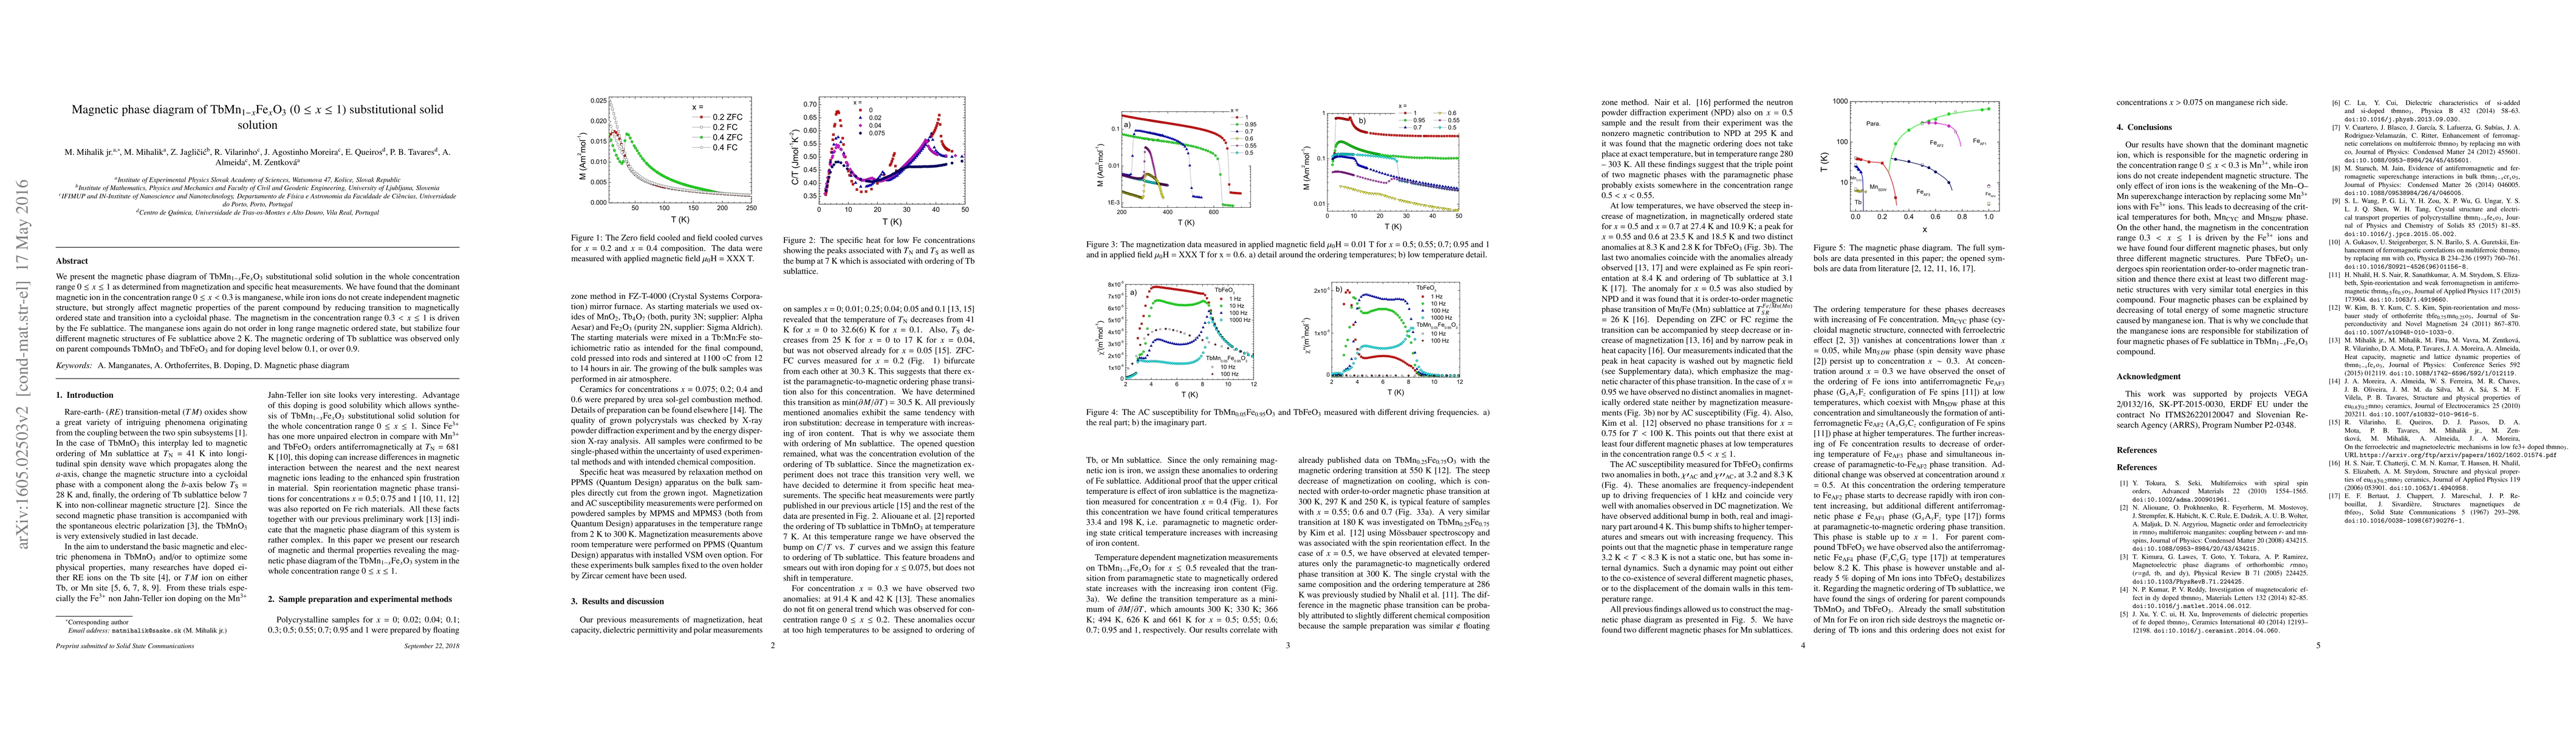
We present the magnetic phase diagram of TbMn1-xFexO3 substitutional solid solution in the whole concentration range 0 <= x <= 1 as determined from magnetization and specific heat measurements. We have found that the dominant magnetic ion in the concentration range 0 <= x < 0.3 is manganese, while iron ions do not create independent magnetic structure, but strongly affect magnetic properties of the parent compound by reducing transition to magnetically ordered state and transition into a cycloidal phase. The magnetism in the concentration range 0.3 < x <= 1 is driven by the Fe sublattice. The manganese ions again do not order in long range magnetic ordered state, but stabilize four different magnetic structures of Fe sublattice above 2 K. The magnetic ordering of Tb sublattice was observed only on parent compounds TbMnO3 and TbFeO3 and for doping level below 0.1, or over 0.9.
AI Key Findings
Get AI-generated insights about this paper's methodology, results, and significance.
Paper Details
PDF Preview
Key Terms
Citation Network
Current paper (gray), citations (green), references (blue)
Display is limited for performance on very large graphs.
No citations found for this paper.
Comments (0)