Publication
Metrics
AI Quick Summary
This paper investigates magneto-acoustic waves in sunspots, revealing standing waves below 4 mHz and propagating waves at higher frequencies, using observational data and numerical simulations. The study identifies the temperature and height of line formation and shows that the simulated wave patterns match observed features, confirming the longitudinal propagation of slow MHD waves along sunspot field lines.
Paper Preview
Abstract
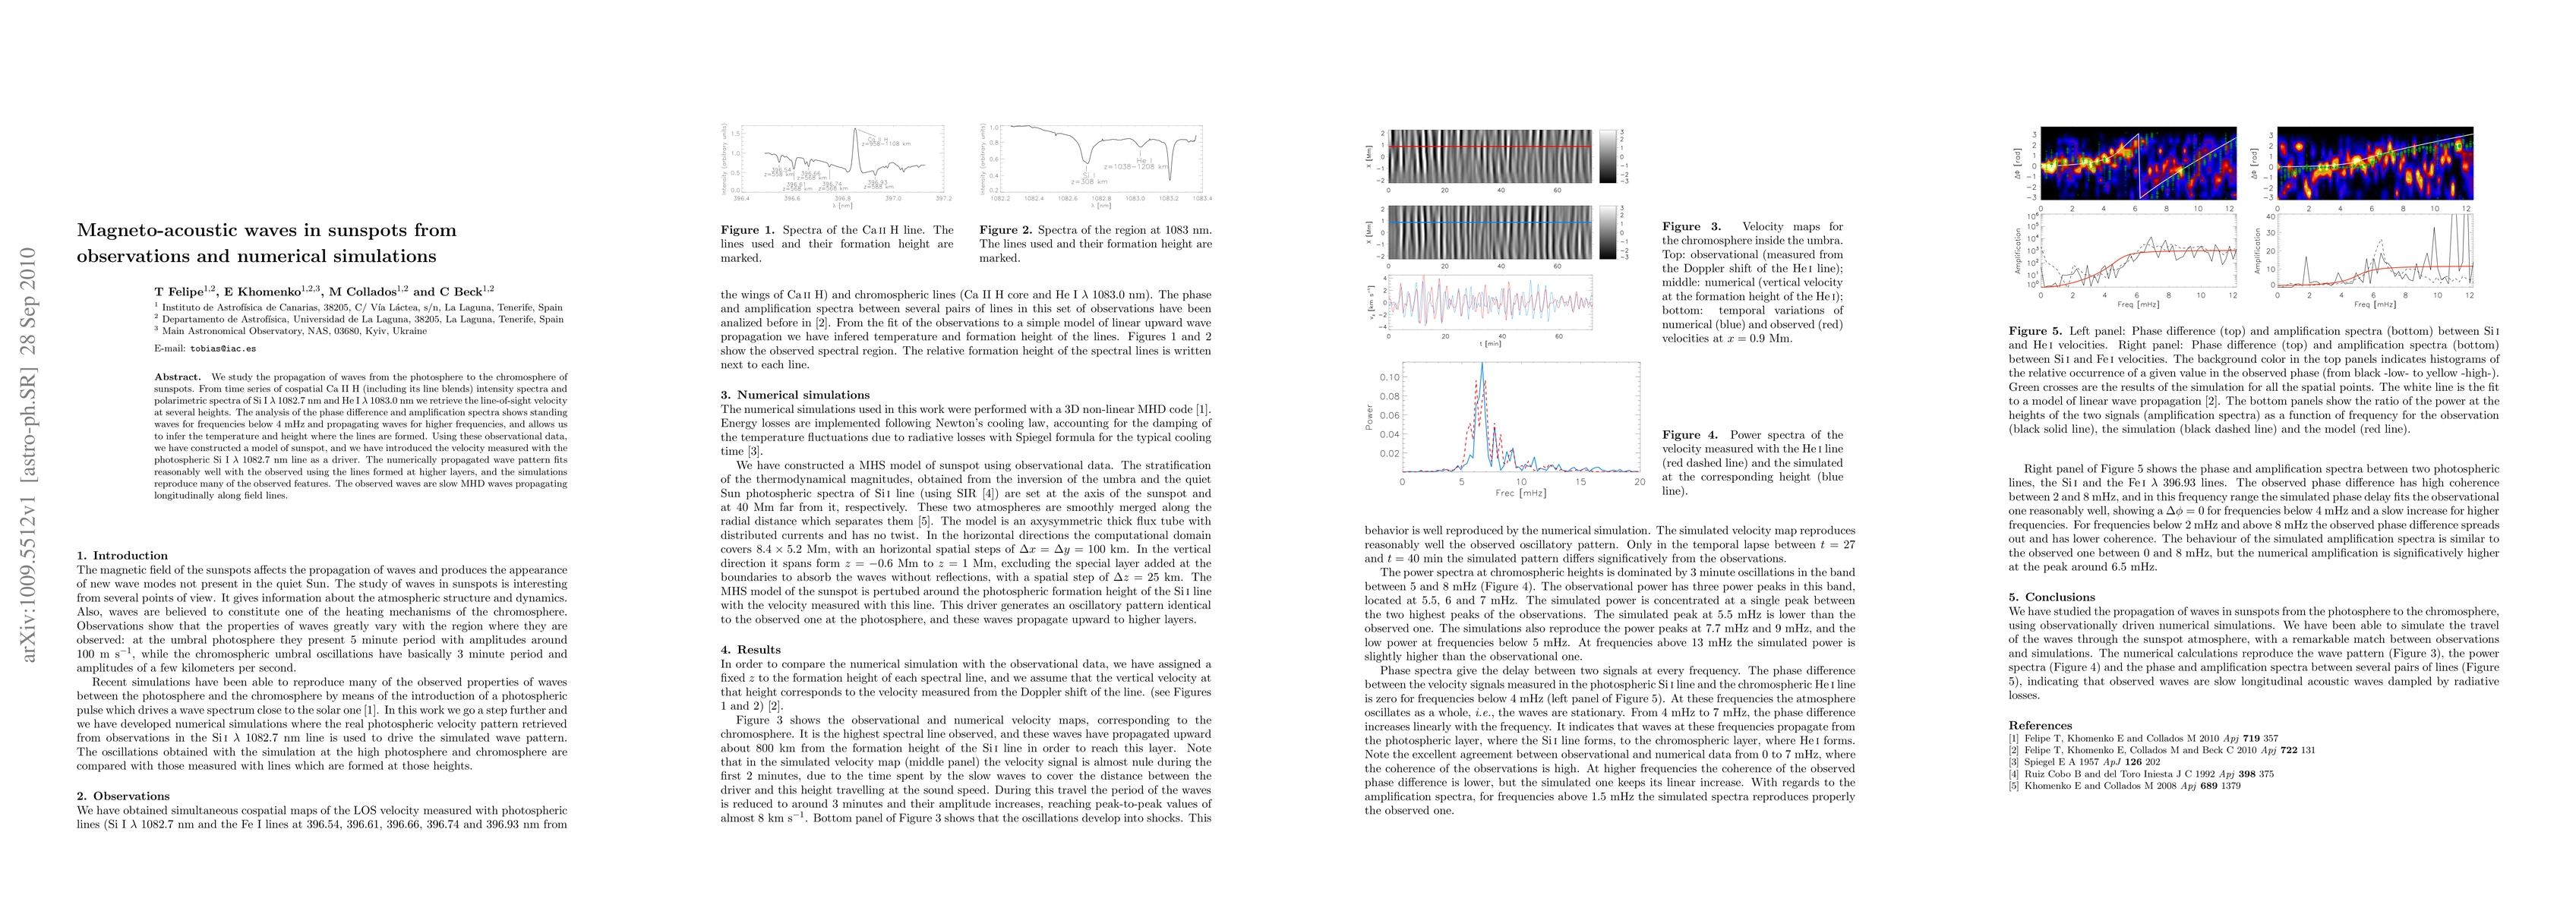
We study the propagation of waves from the photosphere to the chromosphere of sunspots. From time series of cospatial Ca II H (including its line blends) intensity spectra and polarimetric spectra of Si I 1082.7 nm and He I 1083.0 nm we retrieve the line-of-sight velocity at several heights. The analysis of the phase difference and amplification spectra shows standing waves for frequencies below 4 mHz and propagating waves for higher frequencies, and allows us to infer the temperature and height where the lines are formed. Using these observational data, we have constructed a model of sunspot, and we have introduced the velocity measured with the photospheric Si I 1082.7 nm line as a driver. The numerically propagated wave pattern fits reasonably well with the observed using the lines formed at higher layers, and the simulations reproduce many of the observed features. The observed waves are slow MHD waves propagating longitudinally along field lines.
AI Key Findings
Get AI-generated insights about this paper's methodology, results, significance, and more — seven facets brought into focus.
Impact
Paper Details
PDF Preview
Key Terms
Citation Network
Current paper (gray), citations (green), references (blue)
Display is limited for performance on very large graphs.
Discussion 0