Authors
Summary
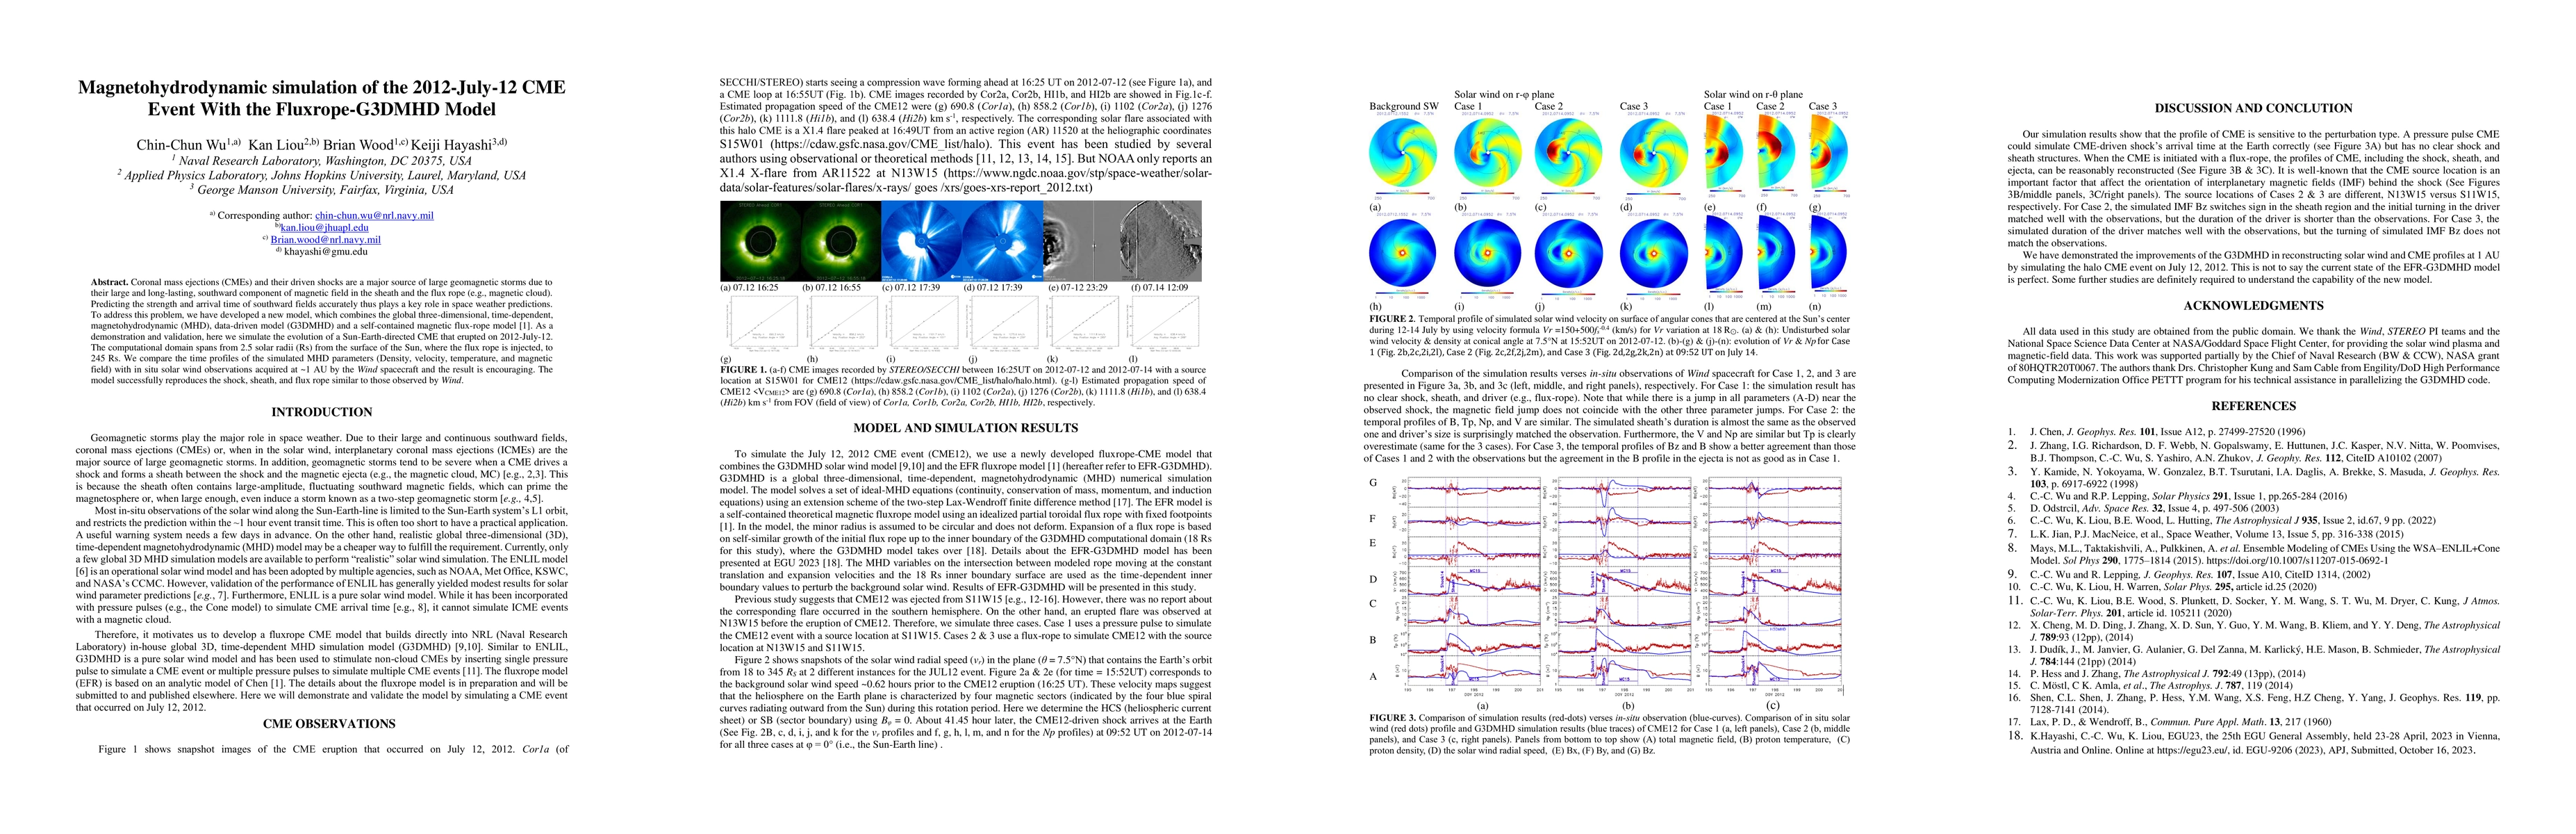
Coronal mass ejections (CMEs) and their driven shocks are a major source of large geomagnetic storms due to their large and long-lasting, southward component of magnetic field in the sheath and the flux rope (e.g., magnetic cloud). Predicting the strength and arrival time of southward fields accurately thus plays a key role in space weather predictions. To address this problem, we have developed a new model, which combines the global three-dimensional, time-dependent, magnetohydrodynamic (MHD), data-driven model (G3DMHD) and a self-contained magnetic flux-rope model [1]. As a demonstration and validation, here we simulate the evolution of a Sun-Earth-directed CME that erupted on 2012-July-12. The computational domain spans from 2.5 solar radii (Rs) from the surface of the Sun, where the flux rope is injected, to 245 Rs. We compare the time profiles of the simulated MHD parameters (Density, velocity, temperature, and magnetic field) with in situ solar wind observations acquired at ~1 AU by the Wind spacecraft and the result is encouraging. The model successfully reproduces the shock, sheath, and flux rope similar to those observed by Wind.
AI Key Findings
Get AI-generated insights about this paper's methodology, results, and significance.
Paper Details
PDF Preview
Key Terms
Citation Network
Current paper (gray), citations (green), references (blue)
Display is limited for performance on very large graphs.
Similar Papers
Found 4 papersEnsemble simulations of the 12 July 2012 Coronal Mass Ejection with the Constant Turn Flux Rope Model
Charles N. Arge, Nikolai V. Pogorelov, Talwinder Singh et al.
No citations found for this paper.
Comments (0)