Publication
Metrics
AI Quick Summary
Manifold is a model-agnostic framework for interpreting and diagnosing machine learning models using visual analysis techniques. It facilitates an iterative process of inspection, explanation, and refinement without requiring access to the model's internal logic, thus supporting comparison across different model types.
Paper Preview
Abstract
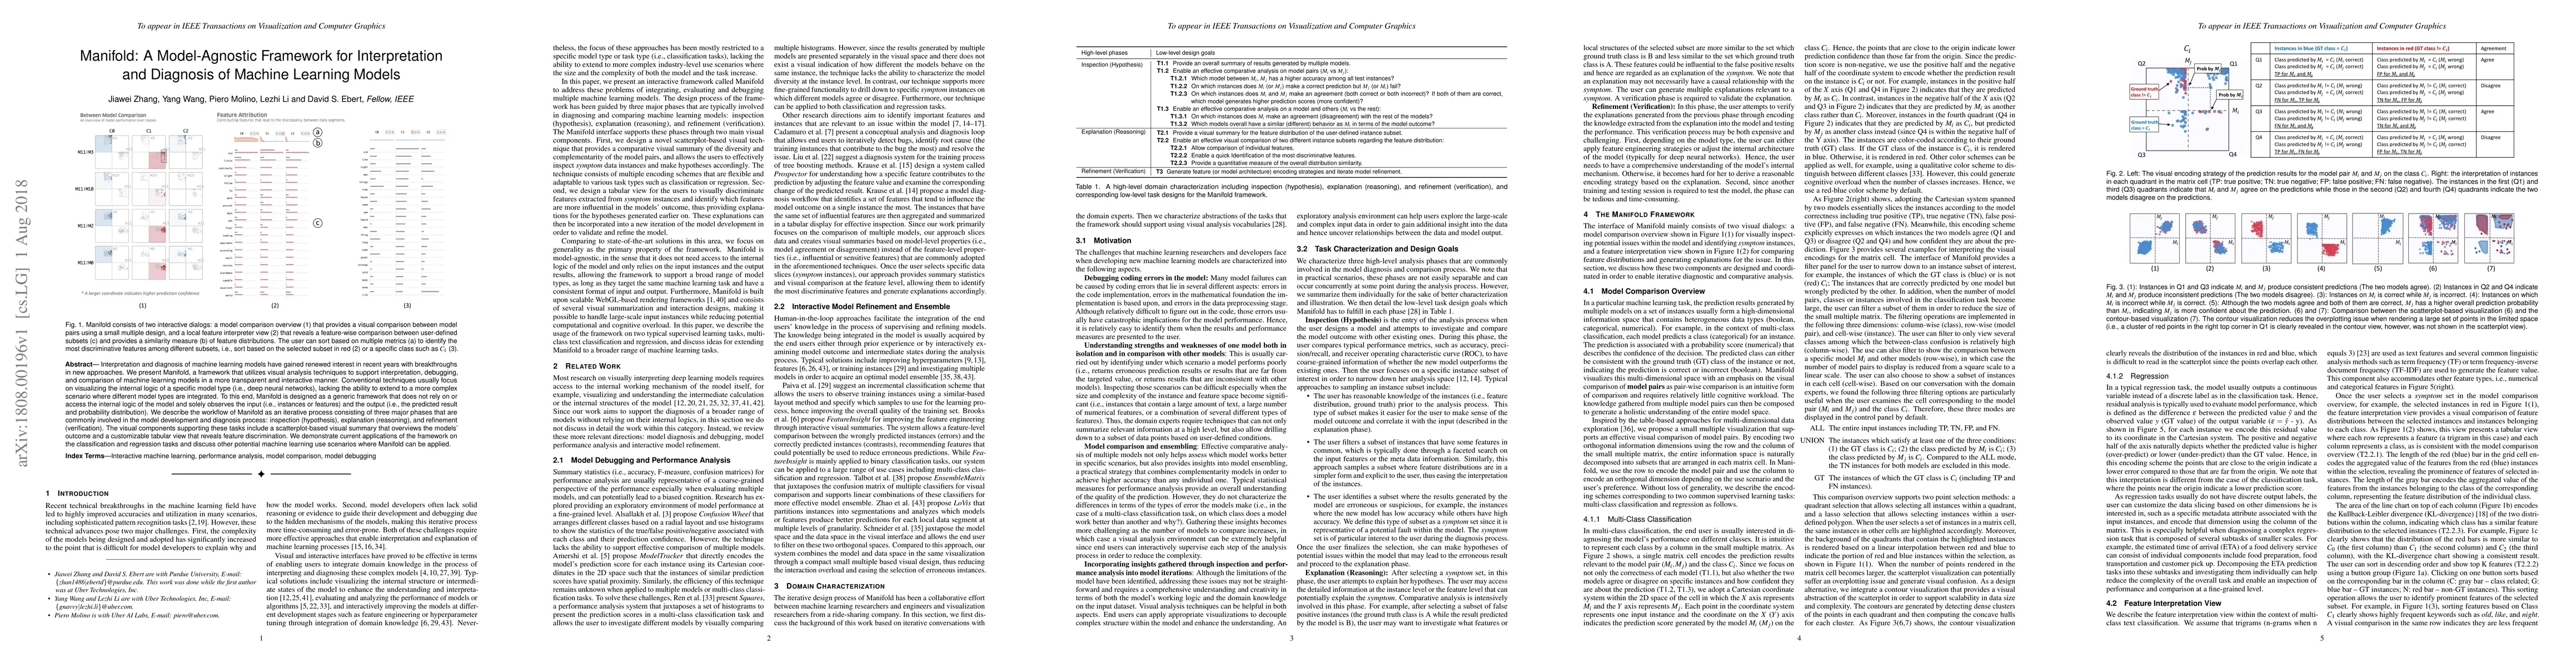
Interpretation and diagnosis of machine learning models have gained renewed interest in recent years with breakthroughs in new approaches. We present Manifold, a framework that utilizes visual analysis techniques to support interpretation, debugging, and comparison of machine learning models in a more transparent and interactive manner. Conventional techniques usually focus on visualizing the internal logic of a specific model type (i.e., deep neural networks), lacking the ability to extend to a more complex scenario where different model types are integrated. To this end, Manifold is designed as a generic framework that does not rely on or access the internal logic of the model and solely observes the input (i.e., instances or features) and the output (i.e., the predicted result and probability distribution). We describe the workflow of Manifold as an iterative process consisting of three major phases that are commonly involved in the model development and diagnosis process: inspection (hypothesis), explanation (reasoning), and refinement (verification). The visual components supporting these tasks include a scatterplot-based visual summary that overviews the models' outcome and a customizable tabular view that reveals feature discrimination. We demonstrate current applications of the framework on the classification and regression tasks and discuss other potential machine learning use scenarios where Manifold can be applied.
AI Key Findings
Get AI-generated insights about this paper's methodology, results, significance, and more — seven facets brought into focus.
Impact
Paper Details
PDF Preview
Key Terms
Citation Network
Current paper (gray), citations (green), references (blue)
Display is limited for performance on very large graphs.
Discussion 0