Mapper Interactive: A Scalable, Extendable, and Interactive Toolbox for the Visual Exploration of High-Dimensional Data
Publication
Metrics
AI Quick Summary
Mapper Interactive is a scalable, extendable web-based toolbox for interactive visualization of high-dimensional data using the mapper algorithm. It significantly speeds up computation and allows for dynamic manipulation and addition of new analysis modules, making topological data analysis accessible to nonspecialists.
Paper Preview
Abstract
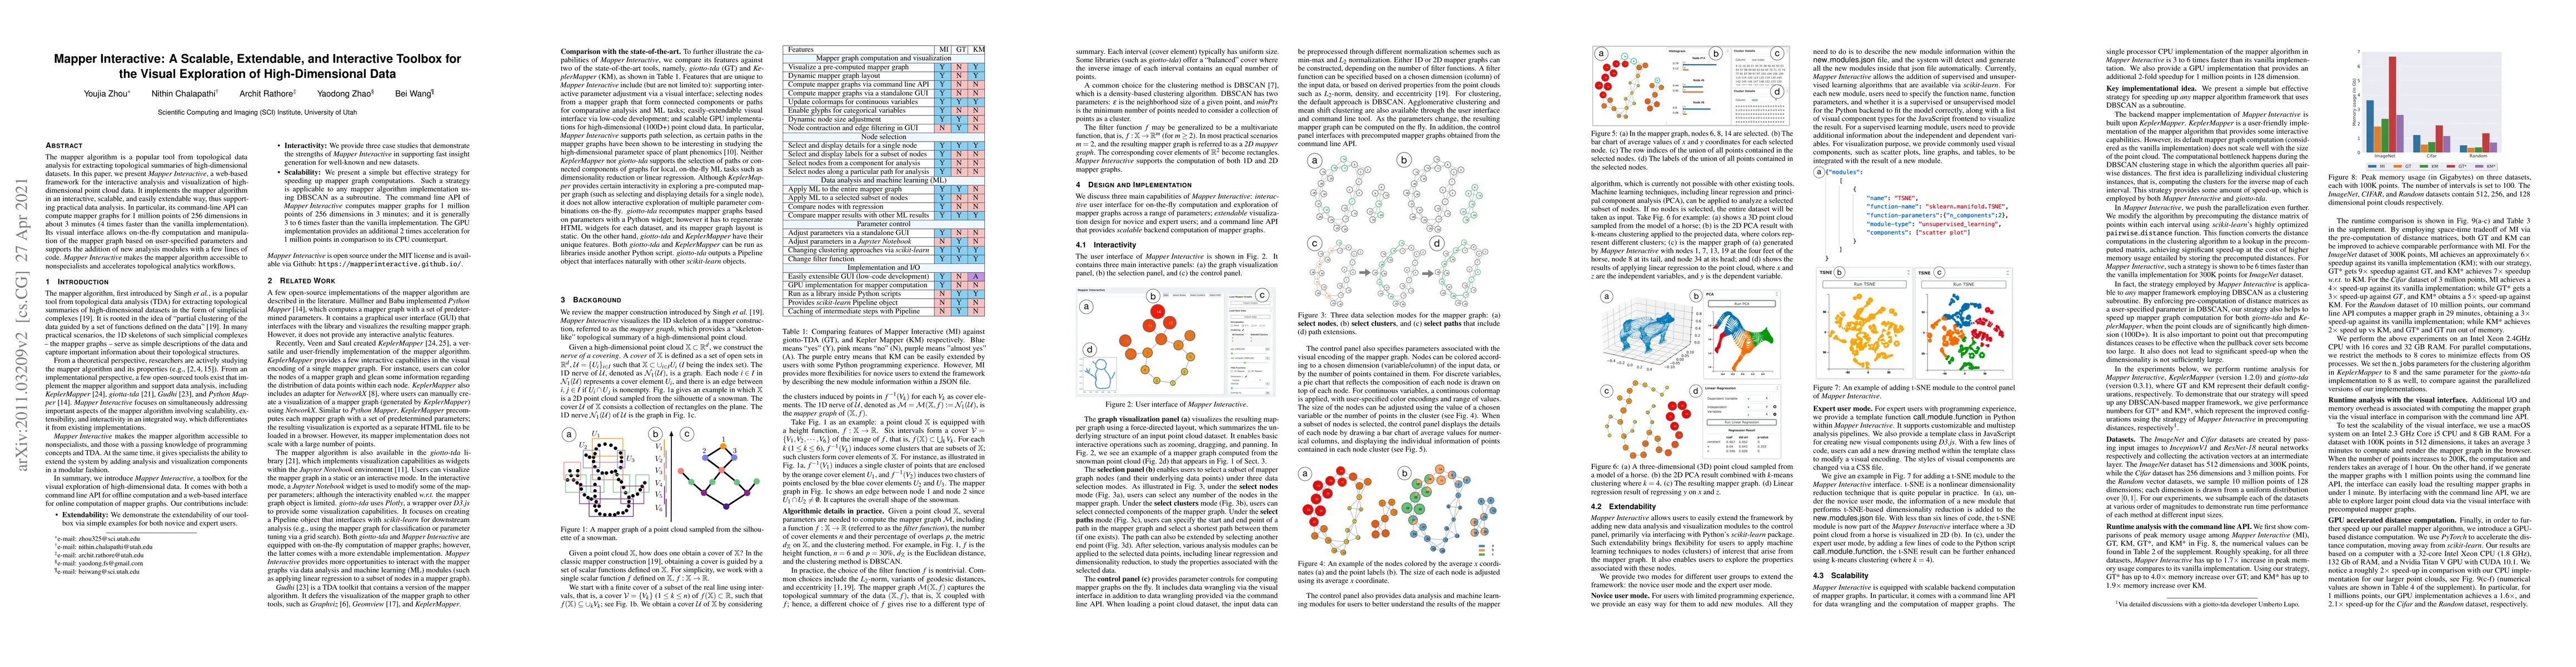
The mapper algorithm is a popular tool from topological data analysis for extracting topological summaries of high-dimensional datasets. In this paper, we present Mapper Interactive, a web-based framework for the interactive analysis and visualization of high-dimensional point cloud data. It implements the mapper algorithm in an interactive, scalable, and easily extendable way, thus supporting practical data analysis. In particular, its command-line API can compute mapper graphs for 1 million points of 256 dimensions in about 3 minutes (4 times faster than the vanilla implementation). Its visual interface allows on-the-fly computation and manipulation of the mapper graph based on user-specified parameters and supports the addition of new analysis modules with a few lines of code. Mapper Interactive makes the mapper algorithm accessible to nonspecialists and accelerates topological analytics workflows.
AI Key Findings
Get AI-generated insights about this paper's methodology, results, significance, and more — seven facets brought into focus.
Impact
Paper Details
PDF Preview
Key Terms
Citation Network
Current paper (gray), citations (green), references (blue)
Display is limited for performance on very large graphs.
Discussion 0