Mapping Global Value Chains at the Product Level
Publication
Metrics
AI Quick Summary
This paper introduces a machine learning-based method to infer detailed product-level global value chain relationships from international trade data, aiming to provide more granular insights than existing aggregate datasets. The method applies to over 300 regions and 1200 products, offering valuable data for logistics, trade, and sustainable development.
Paper Preview
Abstract
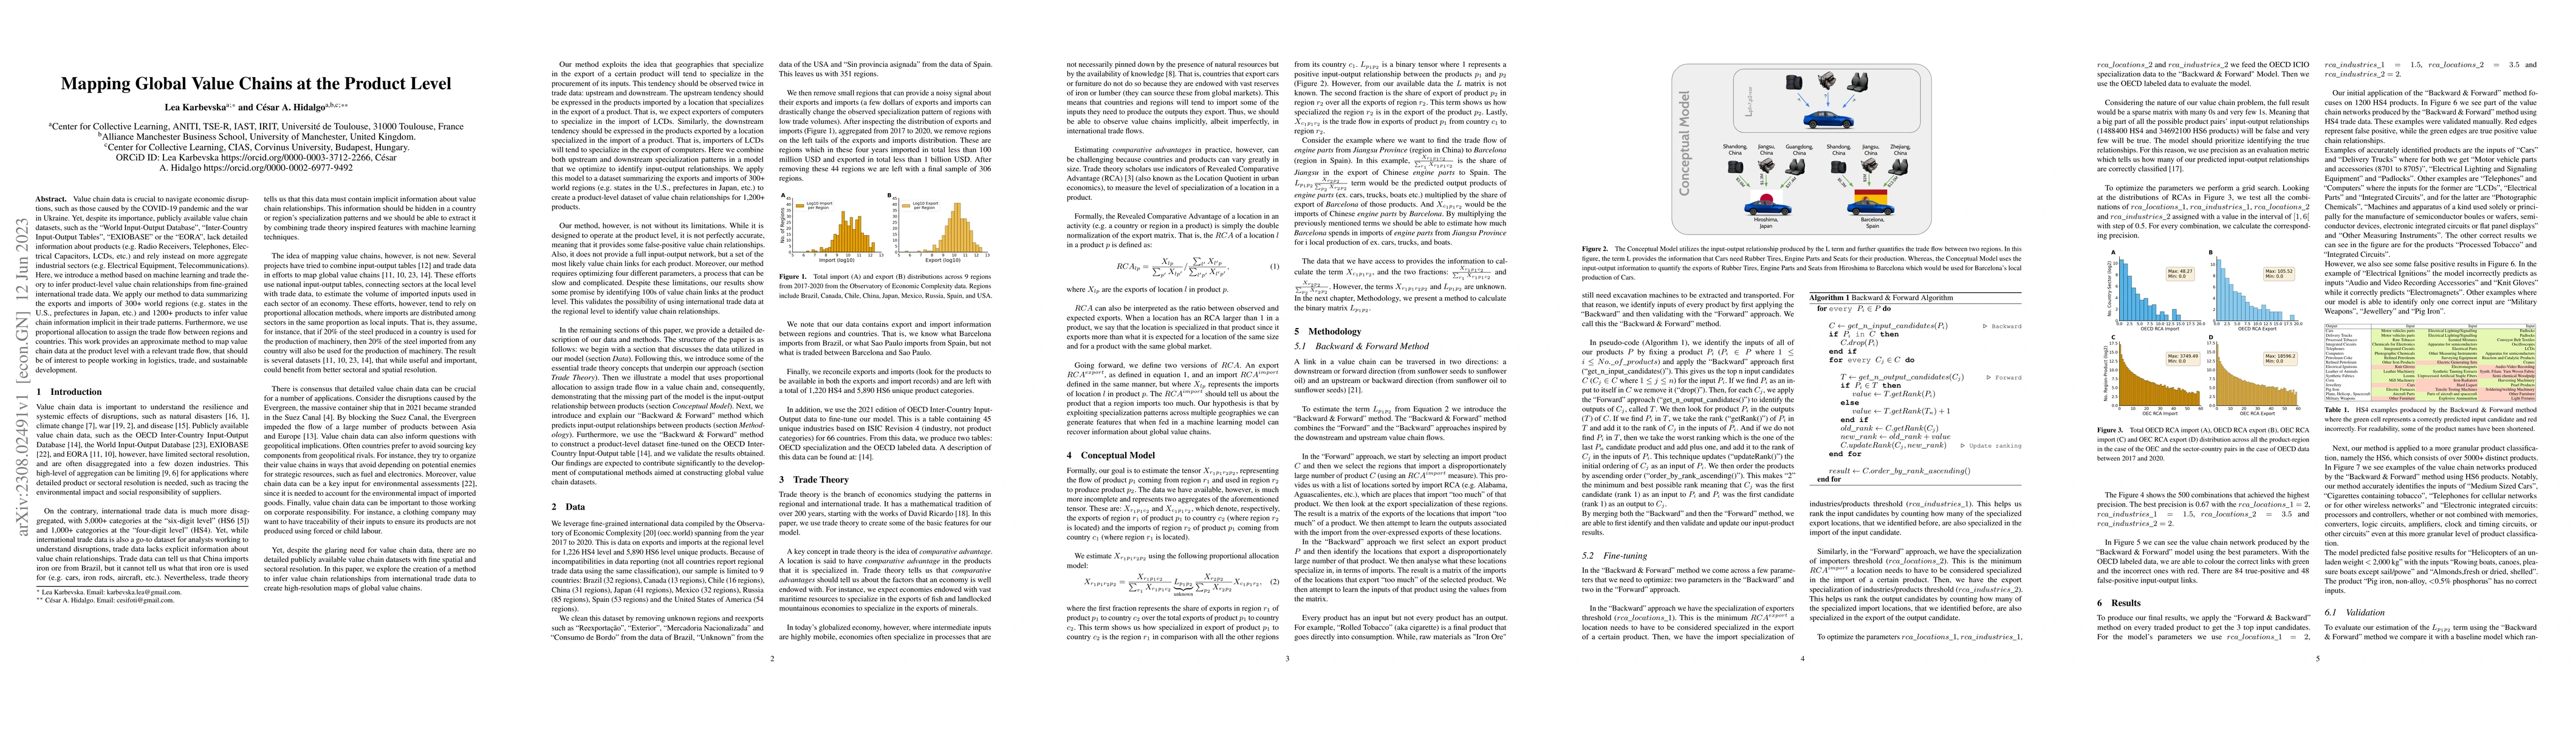
Value chain data is crucial to navigate economic disruptions, such as those caused by the COVID-19 pandemic and the war in Ukraine. Yet, despite its importance, publicly available value chain datasets, such as the ``World Input-Output Database'', ``Inter-Country Input-Output Tables'', ``EXIOBASE'' or the ``EORA'', lack detailed information about products (e.g. Radio Receivers, Telephones, Electrical Capacitors, LCDs, etc.) and rely instead on more aggregate industrial sectors (e.g. Electrical Equipment, Telecommunications). Here, we introduce a method based on machine learning and trade theory to infer product-level value chain relationships from fine-grained international trade data. We apply our method to data summarizing the exports and imports of 300+ world regions (e.g. states in the U.S., prefectures in Japan, etc.) and 1200+ products to infer value chain information implicit in their trade patterns. Furthermore, we use proportional allocation to assign the trade flow between regions and countries. This work provides an approximate method to map value chain data at the product level with a relevant trade flow, that should be of interest to people working in logistics, trade, and sustainable development.
AI Key Findings
Get AI-generated insights about this paper's methodology, results, significance, and more — seven facets brought into focus.
Impact
Paper Details
Authors
PDF Preview
Key Terms
Citation Network
Current paper (gray), citations (green), references (blue)
Display is limited for performance on very large graphs.
Discussion 0