Mapping Local Interstellar Medium With Diffuse Interstellar Bands
Publication
Metrics
AI Quick Summary
This study maps the local interstellar medium using correlations between diffuse interstellar bands and star properties, revealing a structured pattern in the Galactic $x$-coordinate. Variations in physical conditions in nearby molecular clouds may explain discrepancies in observed correlations.
Paper Preview
Abstract
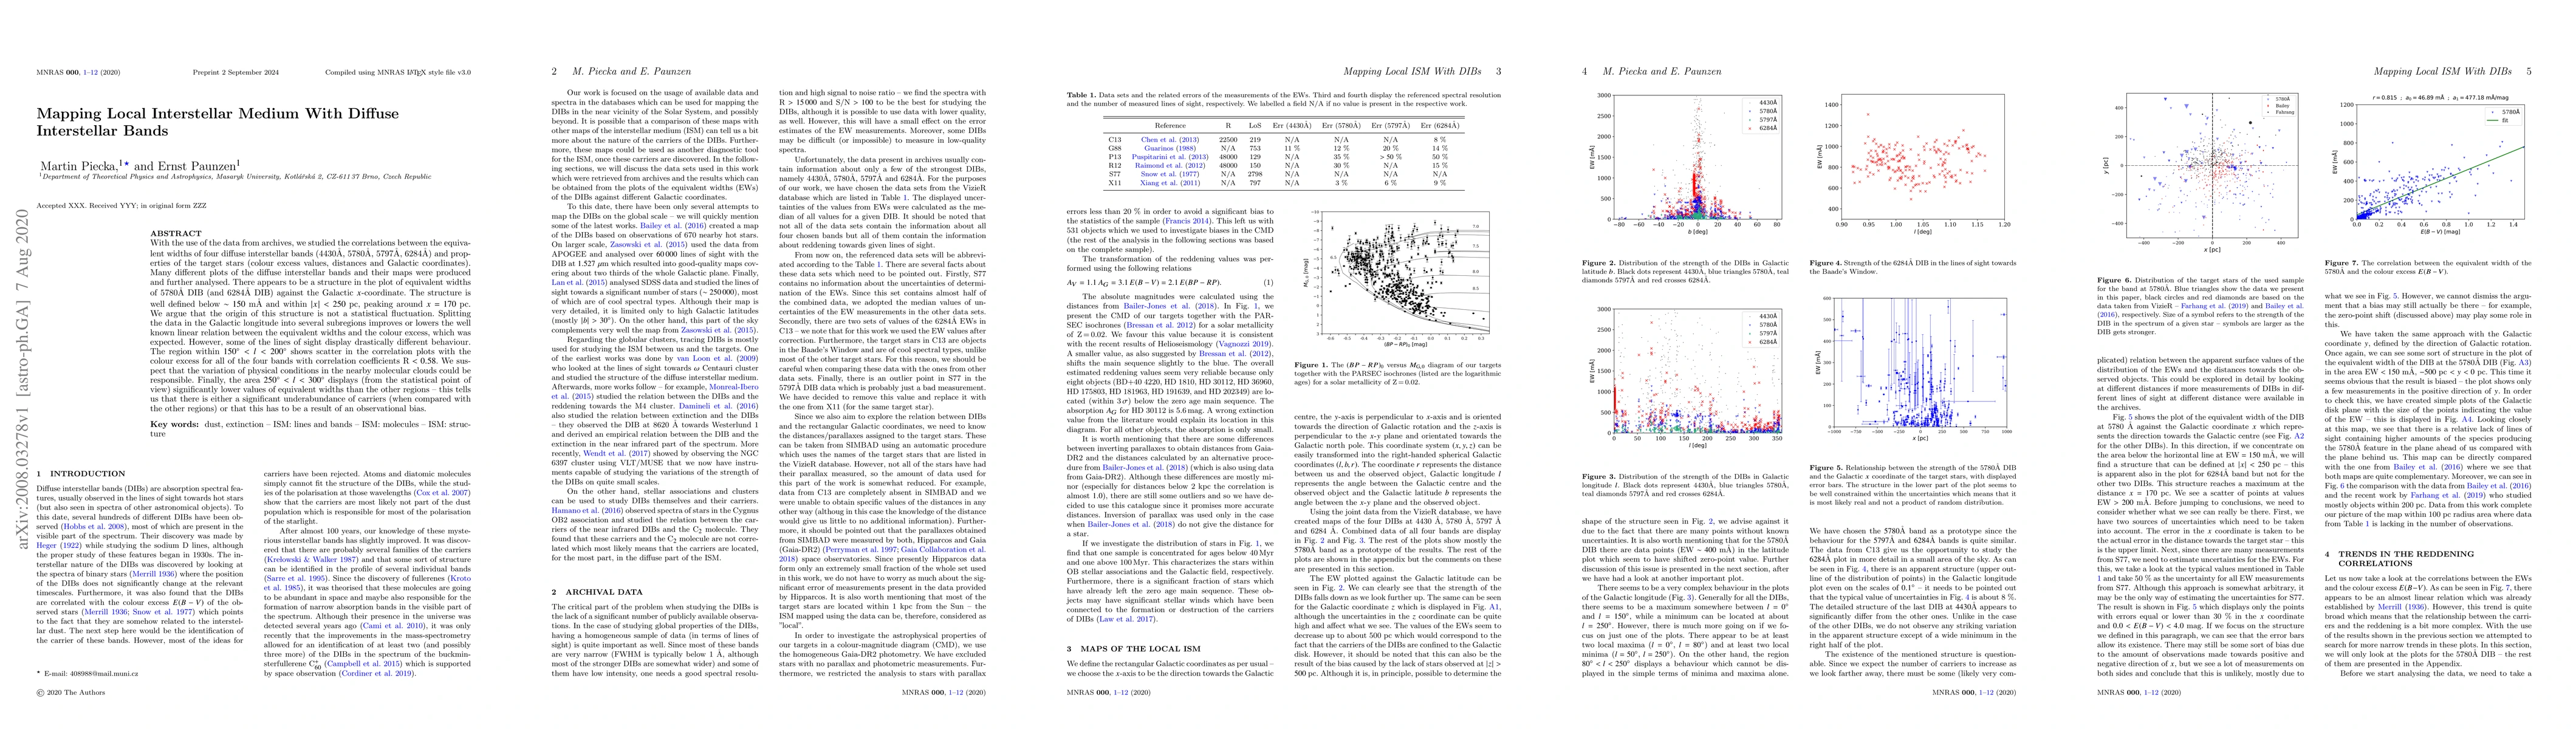
With the use of the data from archives, we studied the correlations between the equivalent widths of four diffuse interstellar bands (4430$\r{A}$, 5780$\r{A}$, 5797$\r{A}$, 6284$\r{A}$) and properties of the target stars (colour excess values, distances and Galactic coordinates). Many different plots of the diffuse interstellar bands and their maps were produced and further analysed. There appears to be a structure in the plot of equivalent widths of 5780$\r{A}$ DIB (and 6284$\r{A}$ DIB) against the Galactic $x$-coordinate. The structure is well defined below $\sim150$ m$\r{A}$ and within $|x|<250$ pc, peaking around $x=170$ pc. We argue that the origin of this structure is not a statistical fluctuation. Splitting the data in the Galactic longitude into several subregions improves or lowers the well known linear relation between the equivalent widths and the colour excess, which was expected. However, some of the lines of sight display drastically different behaviour. The region within $150^\circ
AI Key Findings
Get AI-generated insights about this paper's methodology, results, significance, and more — seven facets brought into focus.
Impact
Paper Details
Authors
PDF Preview
Key Terms
Citation Network
Current paper (gray), citations (green), references (blue)
Display is limited for performance on very large graphs.
Discussion 0