Summary
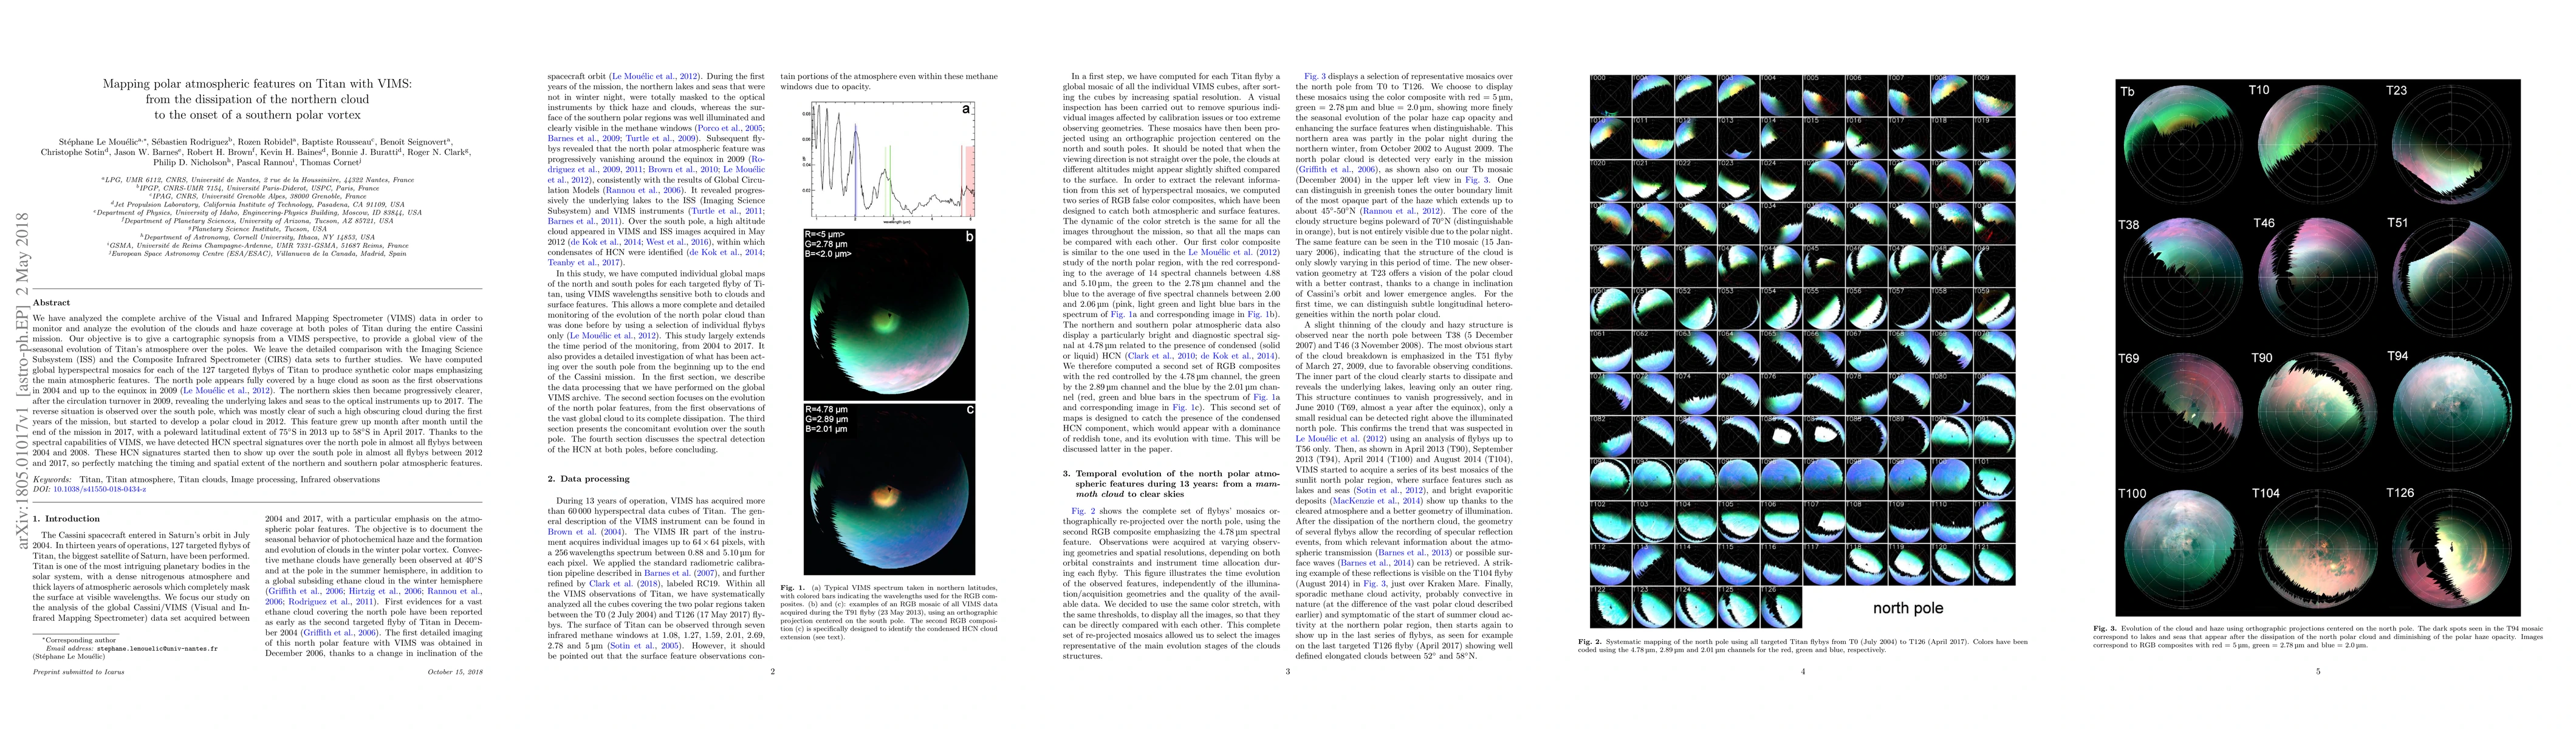
We have analyzed the complete archive of the Visual and Infrared Mapping Spectrometer (VIMS) data in order to monitor and analyze the evolution of the clouds and haze coverage at both poles of Titan during the entire Cassini mission. Our objective is to give a cartographic synopsis from a VIMS perspective, to provide a global view of the seasonal evolution of Titan's atmosphere over the poles. We leave the detailed comparison with the Imaging Science Subsystem (ISS) and the Composite Infrared Spectrometer (CIRS) data sets to further studies. We have computed global hyperspectral mosaics for each of the 127 targeted flybys of Titan to produce synthetic color maps emphasizing the main atmospheric features. The north pole appears fully covered by a huge cloud as soon as the first observations in 2004 and up to the equinox in 2009 (Le Mou\'elic et al. 2012). The northern skies then became progressively clearer, after the circulation turnover in 2009, revealing the underlying lakes and seas to the optical instruments up to 2017. The reverse situation is observed over the south pole, which was mostly clear of such a high obscuring cloud during the first years of the mission, but started to develop a polar cloud in 2012. This feature grew up month after month until the end of the mission in 2017, with a poleward latitudinal extent of 75$^\circ$S in 2013 up to 58$^\circ$S in April 2017. Thanks to the spectral capabilities of VIMS, we have detected HCN spectral signatures over the north pole in almost all flybys between 2004 and 2008. These HCN signatures started then to show up over the south pole in almost all flybys between 2012 and 2017, so perfectly matching the timing and spatial extent of the northern and southern polar atmospheric features.
AI Key Findings
Get AI-generated insights about this paper's methodology, results, and significance.
Paper Details
PDF Preview
Key Terms
Citation Network
Current paper (gray), citations (green), references (blue)
Display is limited for performance on very large graphs.
Similar Papers
Found 4 papersTopology of The Polar Vortex and Montana Weather
Kristian Strommen, Atish Mitra, Sushovan Majhi et al.
| Title | Authors | Year | Actions |
|---|
Comments (0)