Publication
Metrics
AI Quick Summary
A new method uses deep unsupervised machine learning to summarize the diversity of galaxy spectra into a 15x15 map, revealing distinct stellar populations and star-formation histories. The maps can also be used to correlate galaxy morphology with spectral fingerprints.
Paper Preview
Abstract
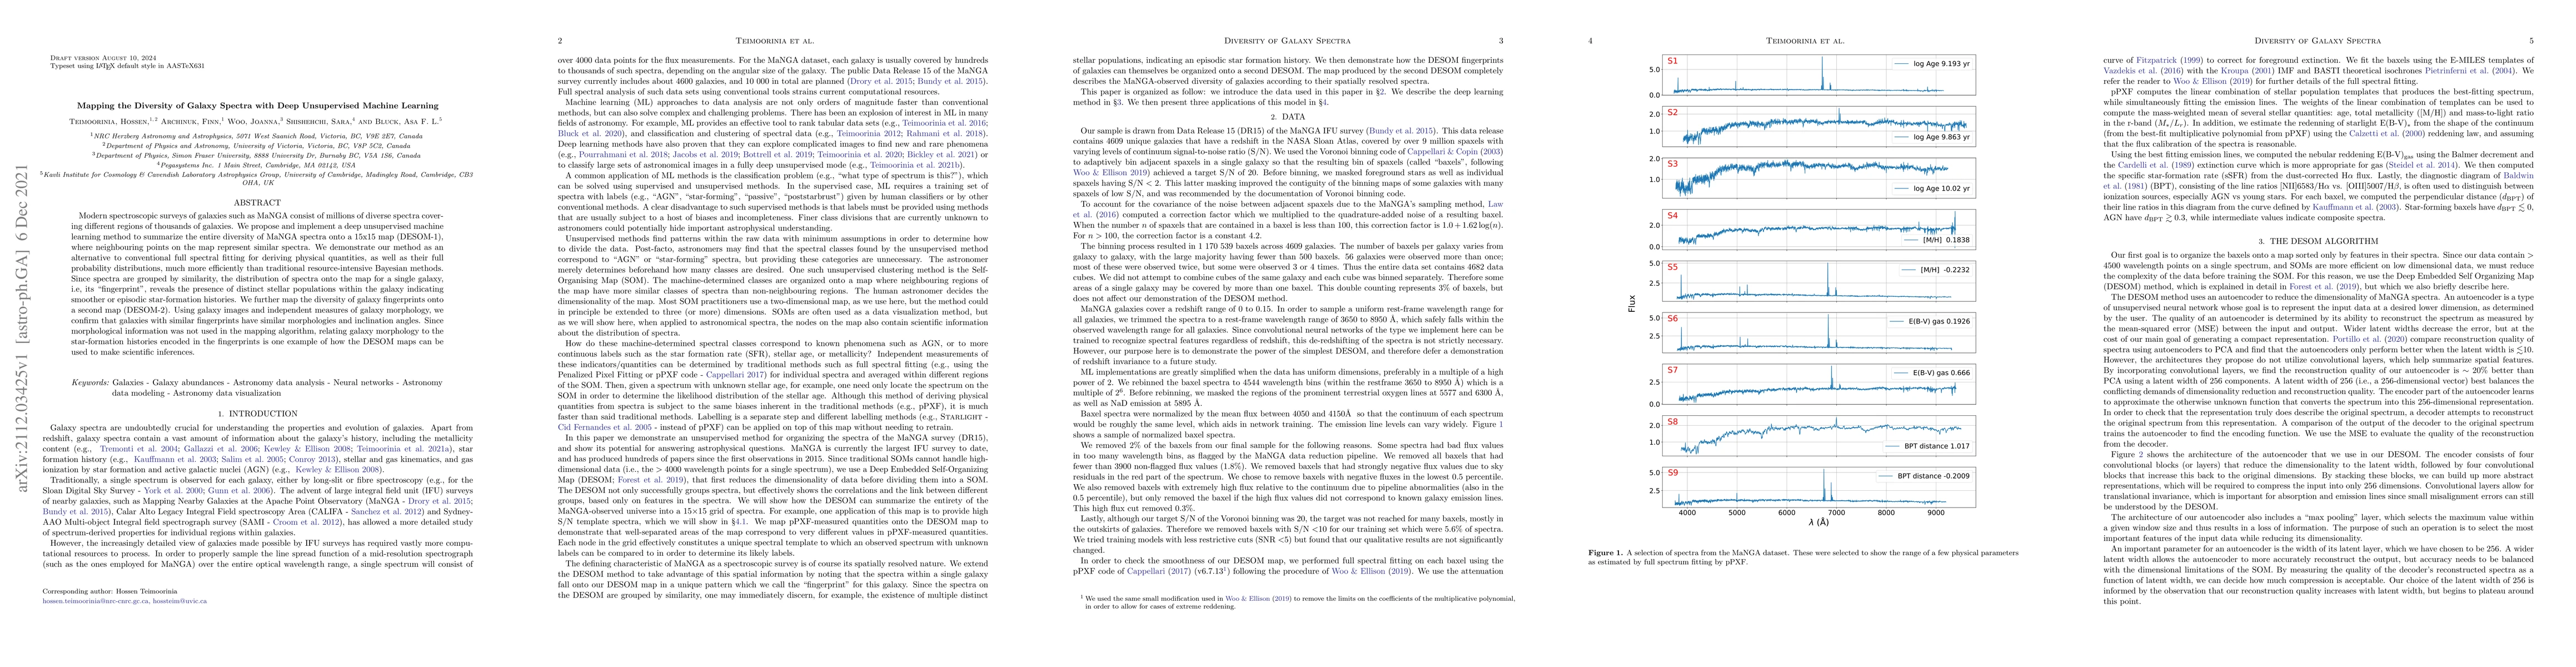
Modern spectroscopic surveys of galaxies such as MaNGA consist of millions of diverse spectra covering different regions of thousands of galaxies. We propose and implement a deep unsupervised machine learning method to summarize the entire diversity of MaNGA spectra onto a 15x15 map (DESOM-1), where neighbouring points on the map represent similar spectra. We demonstrate our method as an alternative to conventional full spectral fitting for deriving physical quantities, as well as their full probability distributions, much more efficiently than traditional resource-intensive Bayesian methods. Since spectra are grouped by similarity, the distribution of spectra onto the map for a single galaxy, i.e., its "fingerprint", reveals the presence of distinct stellar populations within the galaxy indicating smoother or episodic star-formation histories. We further map the diversity of galaxy fingerprints onto a second map (DESOM-2). Using galaxy images and independent measures of galaxy morphology, we confirm that galaxies with similar fingerprints have similar morphologies and inclination angles. Since morphological information was not used in the mapping algorithm, relating galaxy morphology to the star-formation histories encoded in the fingerprints is one example of how the DESOM maps can be used to make scientific inferences.
AI Key Findings
Get AI-generated insights about this paper's methodology, results, significance, and more — seven facets brought into focus.
Impact
Paper Details
Authors
PDF Preview
Key Terms
Citation Network
Current paper (gray), citations (green), references (blue)
Display is limited for performance on very large graphs.
Discussion 0