Quick Summary:

This paper analyzes 668 COVID-19 visualizations to document and organize public health crisis information, presenting a conceptual framework that examines the data sources, messages, and forms used, and concludes with recommendations for future research in crisis visualization.

Summary

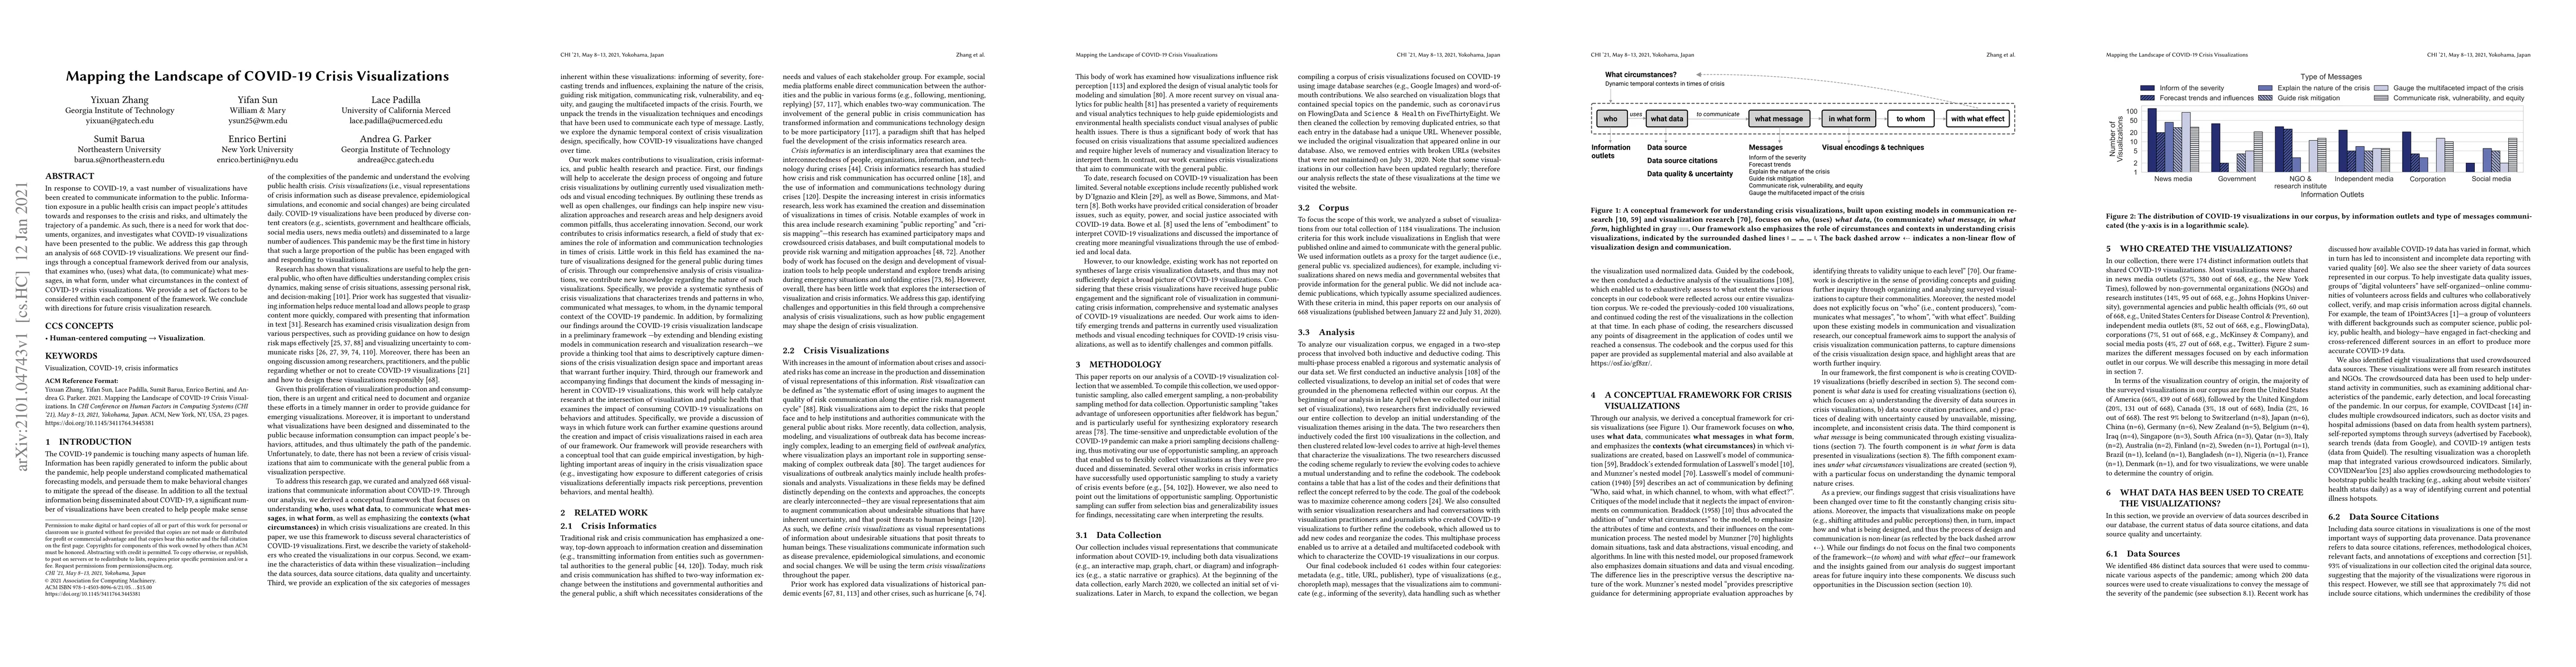
In response to COVID-19, a vast number of visualizations have been created to communicate information to the public. Information exposure in a public health crisis can impact people's attitudes towards and responses to the crisis and risks, and ultimately the trajectory of a pandemic. As such, there is a need for work that documents, organizes, and investigates what COVID-19 visualizations have been presented to the public. We address this gap through an analysis of 668 COVID-19 visualizations. We present our findings through a conceptual framework derived from our analysis, that examines who, (uses) what data, (to communicate) what messages, in what form, under what circumstances in the context of COVID-19 crisis visualizations. We provide a set of factors to be considered within each component of the framework. We conclude with directions for future crisis visualization research.

AI Key Findings

Get AI-generated insights about this paper's methodology, results, and significance.

Paper Details

PDF Preview

Download PDF

Key Terms

covid (0.452)
covid (0.409)
public (0.303)
public (0.301)
pandemic (0.190)
exposure (0.183)
messages (0.181)
documents (0.180)
documents (0.179)
messages (0.178)
exposure (0.178)
visualization (0.176)
vast (0.174)
investigates (0.173)
conceptual (0.173)
ultimately (0.173)
investigates (0.169)
conceptual (0.169)
vast (0.168)
health (0.164)
Title Authors Year Actions
Encountering Friction, Understanding Crises: How Do Digital Natives Make Sense of Crisis Maps?
Laura Koesten, Antonia Saske, Sandra Starchenko, Kathleen Gregory
2025
View Paper
Static Algorithm, Evolving Epidemic: Understanding the Potential of Human-AI Risk Assessment to Support Regional Overdose Prevention
Venkatesh Sivaraman, Yejun Kwak, Courtney C. Kuza, Qingnan Yang, Kayleigh Adamson, Katie Suda, Lu Tang, Walid Gellad, Adam Perer
2025
View Paper
Diagrammatic thinking and audience reading of COVID-19 data visualisations: A UK case study
Jingrong Tong
2024
View Paper
Commemoration and Context: The Death Counter Graphics of COVID-19
Daniel Liddle
2024
View Paper
Visualizing Uncertainty in Time Series Forecasts: The Impact of Uncertainty Visualization on Users' Confidence, Algorithmic Advice Utilization, and Forecasting Performance
Dirk Leffrang, Oliver Müller
2024
View Paper
Toward Guidelines for Designing Holistic Integrated Information Visualizations for Time-Critical Contexts: Systematic Review
Ahmed Mohammed Patel, Weston Baxter, Talya Porat
2024
View Paper
Designing and Evaluating Sampling Strategies for Multiple-Forecast Visualization (MFV)
Ruishi Zou, Siyi Wu, Bingsheng Yao, Dakuo Wang, Lace M. Padilla
2024
View Paper
Enhancing GeoHealth: A step-by-step procedure for spatiotemporal disease mapping
Bart Roelofs, Gerd Weitkamp
2024
View Paper
Drillboards: Adaptive Visualization Dashboards for Dynamic Personalization of Visualization Experiences
Sungbok Shin, Inyoup Na, Niklas Elmqvist
2024
View Paper
Effects of Forecast Order, Cost, and Risk on Decision Making with Multiple Forecast Visualizations
Laura E. Matzen, Mallory C. Stites, Kristin M. Divis, Alexander Bendeck, J. Stasko, Lace M. Padilla
2024
View Paper
Updating a Code for Teaching Ethical Visualizations
William McHenry
2024
View Paper
Misleading Whom? Assumptions about Map Users and Engagement Contexts in COVID-19 Map Misleadingness Claims
Johanna Meyer, D. Stanton Fraser, Julie Barnett
2024
View Paper
Datasets of Visualization for Machine Learning
Can Liu, Ruike Jiang, Shaocong Tan, Jiacheng Yu, Chaofan Yang, Hanning Shao, Xiaoru Yuan
2024
View Paper
Visual narratives to edutain against misleading visualizations in healthcare
Anna Shilo, R. Raidou
2024
View Paper
Design Patterns for Data-Driven News Articles
Shan Hao, Zezhong Wang, Benjamin Bach, Larissa Pschetz
2024
View Paper
Watching the Election Sausage Get Made: How Data Journalists Visualize the Vote Counting Process in U.S. Elections
Mandi Cai, Matthew Kay
2024
View Paper
Flowdashboard: authoring pandemic dashboards with a transparent flow model
Guijuan Wang, Yadong Wu, Jiansong Wang, Hao Guo, Weixin Zhao, Changwei Luo, Lu Tong
2024
View Paper
Data Discretion: Screen-Level Bureaucrats and Municipal Decision-Making
Eric Gordon, John Harlow, Samantha A. Whitman, Myeong Lee
2024
View Paper
Victim blaming and character assassination: Media framing of controversial issues of Bangladesh
M. Nahar, Tasnim Tabassum, Rafikatun Nisa
2024
View Paper
Using data visualizations as information communication tools during a crisis: a critical review
Dennis Mathaisel
2024
View Paper
Images Connect Us Together: Navigating a COVID-19 Local Outbreak in China Through Social Media Images
Changyang He, Lu He, Wenjie Yang, Bo Li
2023
View Paper
Embellishments Revisited: Perceptions of Embellished Visualisations Through the Viewer's Lens
Muna Alebri, Enrico Costanza, Georgia Panagiotidou, Duncan P. Brumby
2023
View Paper
Visual Analytics based Search-Analyze-Forecast Framework for Epidemiological Time-series Data
Tuna Gonen, Y. Xing, C. Turkay, Alfie Abdul-Rahman, R. Jianu, Hui Fang, Euan Freeman, Franck P. Vidal, Min Chen
2023
View Paper
Subjective visualization experiences: impact of visual design and experimental design
Laura Koesten, Drew Dimmery, Michael Gleicher, Torsten Moller
2023
View Paper
Who is the Audience? Designing Casual Data Visualizations for the 'General Public'
Regina Schuster, Laura Koesten, T. Möller, Kathleen Gregory
2023
View Paper
Visual displays for communicating scientific uncertainty in influenza forecasts
Yanran Yang, G. Wong‐Parodi, Baruch Fischhoff
2023
View Paper
Community engagement in the development of health-related data visualizations: a scoping review
Darren Chau, J. Parra, Maricel G Santos, María José Bastías, Rebecca Kim, M. Handley
2023
View Paper
Communicating health information with visual displays
S. Woloshin, Yanran Yang, Baruch Fischhoff
2023
View Paper
From Asymptomatics to Zombies: Visualization-Based Education of Disease Modeling for Children
Graham Mcneill, Max Sondag, Stewart Powell, Phoebe Asplin, C. Turkay, Faron Moller, D. Archambault
2023
View Paper
Misleading Beyond Visual Tricks: How People Actually Lie with Charts
Maxim Lisnic, Cole Polychronis, A. Lex, M. Kogan
2023
View Paper
What is the message? Perspectives on Visual Data Communication
Laura Koesten, Kathleen Gregory, Regina Schuster, Christian Knoll, Sarah Davies, T. Möller
2023
View Paper
Communication of Statistics and Evidence in Times of Crisis
C. Schneider, J. Kerr, S. Dryhurst, J. Aston
2023
View Paper
ClinicLens: Visual Analytics for Exploring and Optimizing the Testing Capacity of Clinics given Uncertainty
Yu Dong, Jie Liang, Longbing Cao, D. Catchpoole
2023
View Paper
An analytical tool to support public policies and isolation barriers against SARS-CoV-2 based on mobility patterns and socio-economic aspects
Julio Cezar Soares Silva, Diogo Silva, Nivan Roberto Ferreira Júnior, Adiel Almeida Filho
2023
View Paper
A Tool for Visualization and Analysis of Neighbourhoods, Clusters, and Indicators during the COVID-19 Pandemic
Julio Cezar Soares Silva, Nivan Ferreira, Adiel Teixeira de Almeida Filho
2023
View Paper
What Do We Mean When We Talk about Trust in Social Media? A Systematic Review
Yixuan Zhang, Joseph D. Gaggiano, Nutchanon Yongsatianchot, Nurul M. Suhaimi, Miso Kim, Yifan Sun, Jacqueline A. Griffin, Andrea G. Parker
2023
View Paper
When do data visualizations persuade? The impact of prior attitudes on learning about correlations from scatterplot visualizations
D. Markant, Milad Rogha, Alireza Karduni, Ryan Wesslen, Wenwen Dou
2023
View Paper
A visual modeling method for spatiotemporal and multidimensional features in epidemiological analysis: Applied COVID-19 aggregated datasets
Yu Dong, Christy Jie Liang, Yi Chen, Jie Hua
2023
View Paper
Reading and Reasoning over Chart Images for Evidence-based Automated Fact-Checking
Mubashara Akhtar, O. Cocarascu, E. Simperl
2023
View Paper
Evaluation of an Immersive COVID-19 Data Visualization
Furkan Kaya, E. Celik, Anil Ufuk Batmaz, Aunnoy K. Mutasim, W. Stuerzlinger, M. Potel
2023
View Paper
A Survey on Data-driven COVID-19 and Future Pandemic Management
Yudong Tao, Chuang Yang, Tianyi Wang, Erik Coltey, Yanxiu Jin, Yinghao Liu, Renhe Jiang, Z. Fan, Xuan Song, R. Shibasaki, Shu-Ching Chen, Mei-Ling Shyu, Steven Luis
2022
View Paper
User-centered visual explorer of in-process comparison in spatiotemporal space
Dong Yu, Ian Oppermann, Jie Liang, Xiaoru Yuan, Nguyen Quang Vinh
2022
View Paper
Web-Based COVID-19 Dashboards and Trackers in the United States: Survey Study
Melissa D. Clarkson
2022
View Paper
Can Data Visualizations Change Minds? Identifying Mechanisms of Elaborative Thinking and Persuasion
D. Markant, Milad Rogha, Alireza Karduni, Ryan Wesslen, Wenwen Dou
2022
View Paper
Multiple Forecast Visualizations (MFVs): Trade-offs in Trust and Performance in Multiple COVID-19 Forecast Visualizations
Lace M. K. Padilla, Racquel Fygenson, Spencer C. Castro, E. Bertini
2022
View Paper
Analysis of State Transition of COVID-19 Positive Cases in Tokyo, Japan and its Application to Agent Simulation
Y. Takama
2022
View Paper
Taking a Language Detour: How International Migrants Speaking a Minority Language Seek COVID-Related Information in Their Host Countries
G. Gao, J. Zheng, E. Choe, Naomi Yamashita
2022
View Paper
Using HCI in Cross-Disciplinary Teams: A Case Study of Academic Collaboration in HCI-Health Teams in the US Using a Team Science Perspective
Elena Agapie, S. Haldar, Sharmaine Galvez Poblete
2022
View Paper
The Accessibility of Data Visualizations on the Web for Screen Reader Users: Practices and Experiences During COVID-19
Danyang Fan, Alexa Fay Siu, Hrishikesh V. Rao, Gene S.-H. Kim, Xavier Vazquez, Lucy Greco, Sile O'Modhrain, Sean Follmer
2022
View Paper
Visualization Design Practices in a Crisis: Behind the Scenes with COVID-19 Dashboard Creators
Yixuan Zhang, Yifan Sun, Joseph D. Gaggiano, Neha Kumar, Clio Andris, Andrea G. Parker
2022
View Paper
A Comparative Study of Methods for the Visualization of Probability Distributions of Geographical Data
Sanjana Srabanti, C. Veiga, E. Silva, Marcos Lage, Nivan Ferreira, Fabio Miranda
2022
View Paper
QDS-COVID: A visual analytics system for interactive exploration of millions of COVID-19 healthcare records in Brazil
Juan C. Carbajal Ipenza, N. M. L. Romero, Melina Loreto, Nivan Roberto Ferreira Júnior, J. Comba
2022
View Paper
Dashboard Design Patterns
B. Bach, Euan Freeman, Alfie Abdul-Rahman, C. Turkay, Saiful Khan, Yulei Fan, Min Chen
2022
View Paper
The Importance of Data Visualization in Combating a Pandemic.
Anamaria Crisan
2022
View Paper
Visualizing Urban Accessibility: Investigating Multi-Stakeholder Perspectives through a Map-based Design Probe Study
Manaswi Saha, Siddhant Patil, E. Cho, Evie (Yu-Yen) Cheng, Chris Horng, Devanshi, Chauhan, Rachel Kangas, Richard McGovern, Anthony Li, Jeffrey Heer, Jon E. Froehlich, Chris, Horng, Devanshi Chauhan
2022
View Paper
Cultural Influences on Chinese Citizens’ Adoption of Digital Contact Tracing: A Human Infrastructure Perspective
Yaojun Lyu, John Millar Carroll
2022
View Paper
Towards Immersive Humanitarian Visualizations
Pierre Dragicevic
2022
View Paper
ComputableViz: Mathematical Operators as a Formalism for Visualisation Processing and Analysis
Aoyu Wu, Wai Tong, Haotian Li, Dominik Moritz, Yong Wang, Huamin Qu
2022
View Paper
The aesthetic turn in border studies: Visual geographies of power, contestation and subversion
Francesco Moze, S. Spiegel
2022
View Paper
Shifting Trust: Examining How Trust and Distrust Emerge, Transform, and Collapse in COVID-19 Information Seeking
Yixuan Zhang, Nurul M. Suhaimi, Nutchanon Yongsatianchot, Joseph D. Gaggiano, Miso Kim, Shivani A. Patel, Yifan Sun, S. Marsella, Jacqueline A. Griffin, Andrea G. Parker
2022
View Paper
Understanding the Digital News Consumption Experience During the COVID Pandemic
M. Zhang, Ashley Boone, Sara M. Behbakht, Alexis Hiniker
2022
View Paper
Political affiliation moderates subjective interpretations of COVID-19 graphs
Jonathan D. Ericson, William S. Albert, Jacob Duane
2022
View Paper
The experiences of 33 national COVID-19 dashboard teams during the first year of the pandemic in the World Health Organization European Region: A qualitative study
E. Barbazza, D. Ivanković, K. Davtyan, M. Poldrugovac, Z. Yelgezekova, C. Willmington, B. Meza-Torres, V. Bos, Ó. Fernandes, A. Rotar, S. Nuti, M. Vainieri, F. Carinci, N. Azzopardi-Muscat, O. Groene, D. Novillo-Ortiz, N. Klazinga, D. Kringos
2022
View Paper
Cartographies on COVID-19 and functional divisions of the territory: an analysis on the evolution of the pandemic based on Basic Health Areas (BHA) in Castile and Leon (Spain)
Gonzalo Andrés López, Daniel Herrero Luque, Marta Martínez Arnáiz
2021
View Paper
Visualizing accessibility with choropleth maps
David Li, H. Samet, Amitabh Varshney
2021
View Paper
Designing an interactive real-time web-mapped dashboard to visualise conflict ceasefires data over COVID-19 infection rates: facilities and the way ahead
D. Bhattacharya, S. Badanjak, C. Bell, Fiona Knäussel, L. Wise, John Allison, Benjamin Bach
2021
View Paper
Local, Interactive, and Actionable: a Pandemic Behavioral Nudge
Alex Rich, C. Yick, David Gotz
2021
View Paper
Impact of COVID-19 forecast visualizations on pandemic risk perceptions
Lace M. K. Padilla, Helia Hosseinpour, Racquel Fygenson, J. Howell, R. Chunara, E. Bertini
2021
View Paper
Examining Effort in 1D Uncertainty Communication Using Individual Differences in Working Memory and NASA-TLX
Spencer C. Castro, P. S. Quinan, Helia Hosseinpour, Lace M. K. Padilla
2021
View Paper
Proof-of-Vax: Studying User Preferences and Perception of Covid Vaccination Certificates
Marvin Kowalewski, Franziska Herbert, Theodor Schnitzler, Markus Dürmuth
2021
View Paper
Viral Visualizations: How Coronavirus Skeptics Use Orthodox Data Practices to Promote Unorthodox Science Online
Crystal Lee, Tanya Yang, Gabrielle Inchoco, Graham M. Jones, Arvind Satyanarayan
2021
View Paper
DRS Digital Library DRS Digital Library
Elena Aversa, Michele Mauri
2023
View Paper
"Fast, Easy, Convenient." Studying Adoption and Perception of Digital Covid Certificates
Franziska Herbert, Marvin Kowalewski, Theodor Schnitzler, Leona Lassak
2022
View Paper
Analysis and Agent Simulation of State Transition of COVID-19 Positive Cases in Tokyo, Japan
Y. Takama
2021
View Paper
Necklace Maps for COVID-19 Visualization
Mary Abikoye
2021
View Paper
Necklace Maps for COVID-19 Visualization
Mary Abikoye, Minglong Li, Jocelyn Minns
2021
View Paper
Edinburgh Research Explorer Dashboard Design Patterns
Benjamin Bach, Euan Freeman, Alfie Abdul-Rahman, C. Turkay, Saiful Khan, Yulei Fan, Min Chen
View Paper
Edinburgh Research Explorer Design patterns for data-driven news articles
View Paper

Comments (0)

This website uses cookies to ensure you get the best experience. Learn more