Mapping the Phase Diagram of the Vicsek Model with Machine Learning
Publication
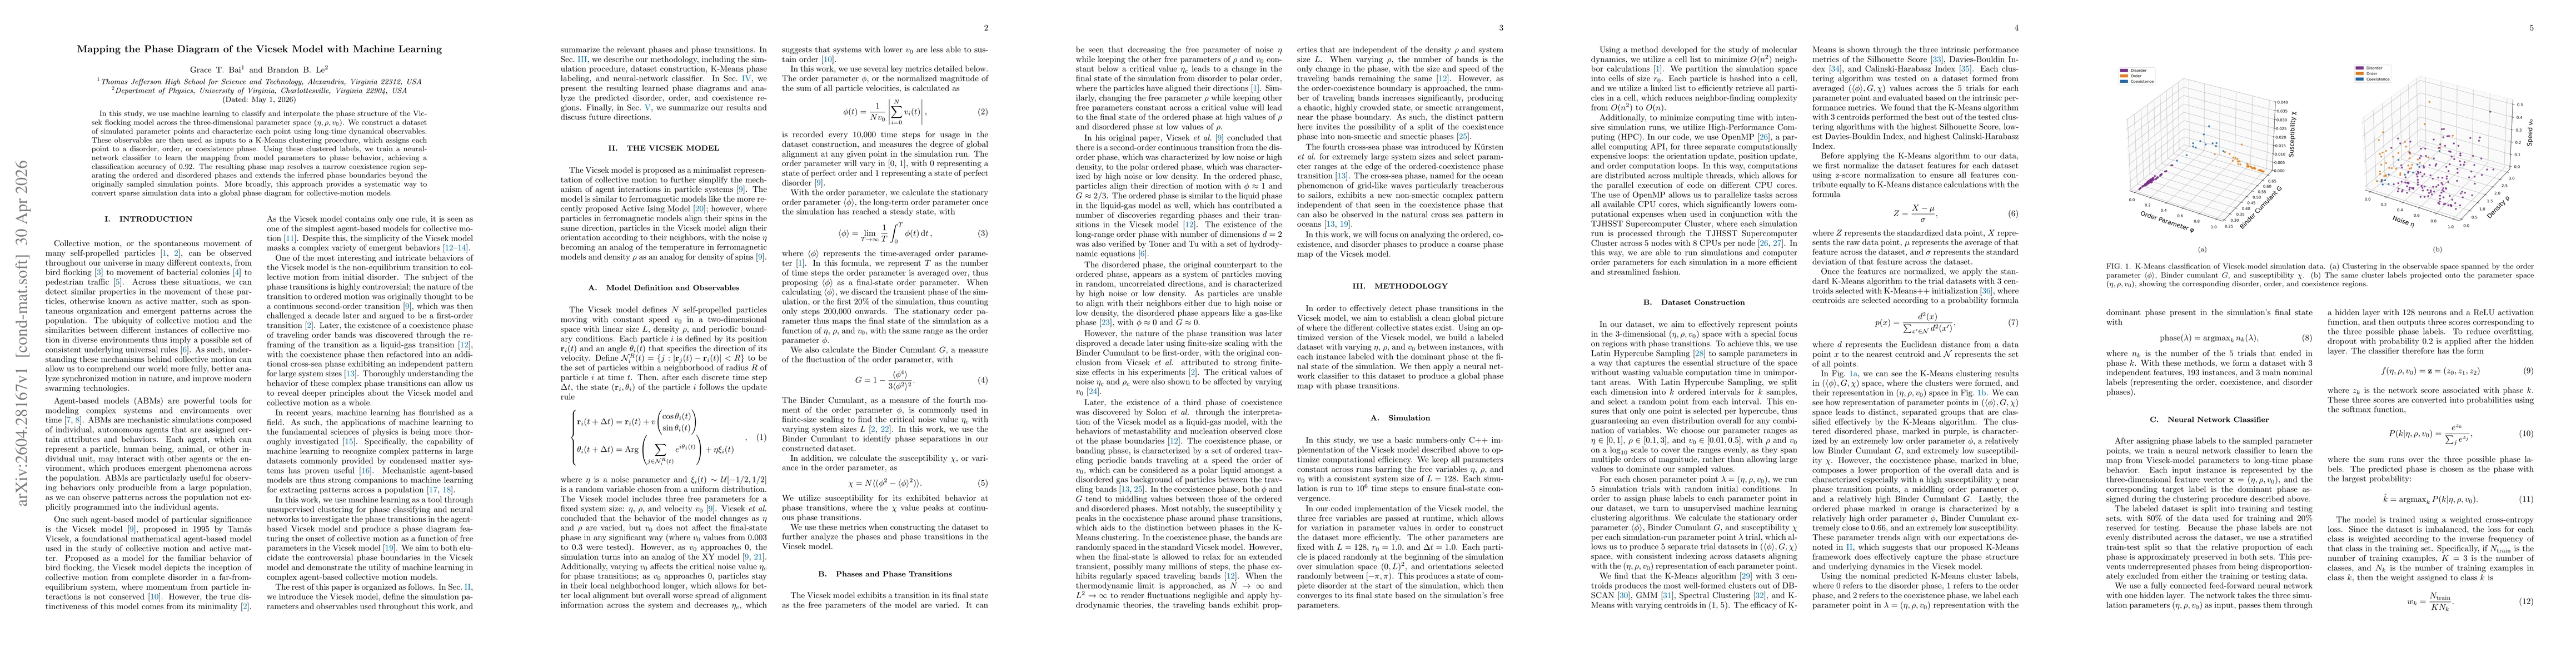
Metrics
Paper Preview
Abstract
In this study, we use machine learning to classify and interpolate the phase structure of the Vicsek flocking model across the three-dimensional parameter space $(η,ρ,v_0)$. We construct a dataset of simulated parameter points and characterize each point using long-time dynamical observables. These observables are then used as inputs to a K-Means clustering procedure, which assigns each point to a disorder, order, or coexistence phase. Using these clustered labels, we train a neural-network classifier to learn the mapping from model parameters to phase behavior, achieving a classification accuracy of 0.92. The resulting phase map resolves a narrow coexistence region separating the ordered and disordered phases and extends the inferred phase boundaries beyond the originally sampled simulation points. More broadly, this approach provides a systematic way to convert sparse simulation data into a global phase diagram for collective-motion models.
AI Key Findings
Get AI-generated insights about this paper's methodology, results, significance, and more — seven facets brought into focus.
Discussion 0