Publication
Metrics
AI Quick Summary
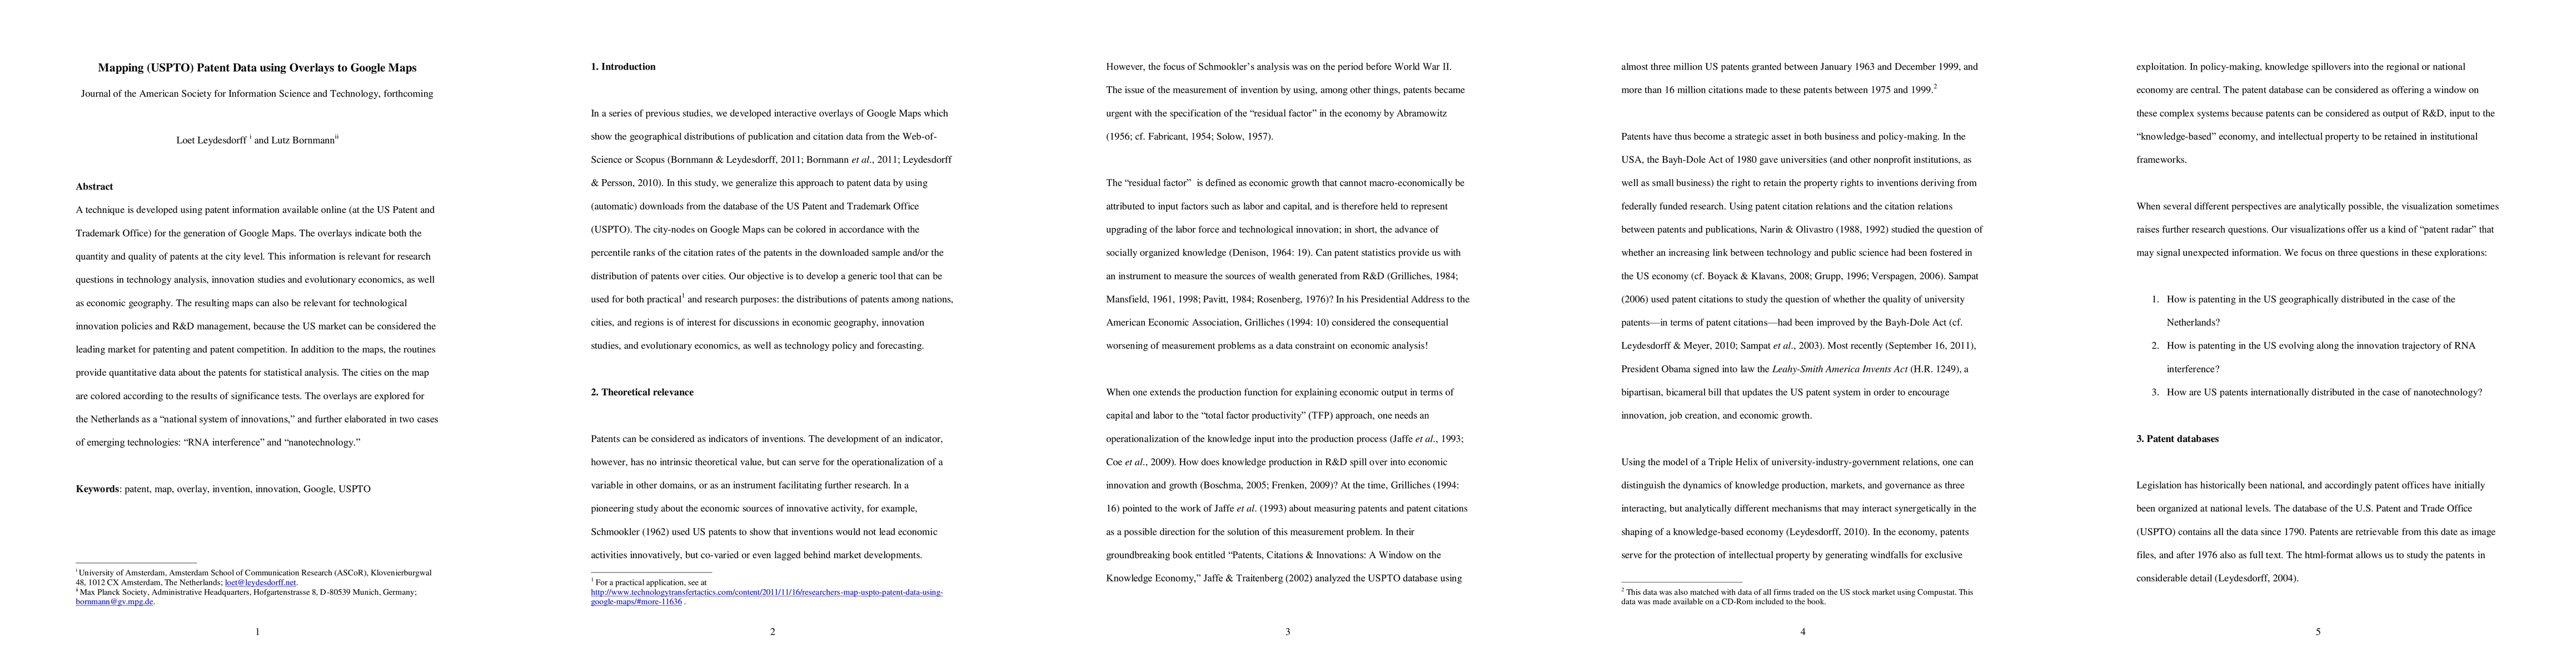
This paper develops a method to overlay USPTO patent data on Google Maps, visualizing both patent quantity and quality at city levels. The maps are useful for technology analysis, innovation studies, and economic geography, and can inform technological innovation policies and R&D management, particularly in the leading US patent market.
Paper Preview
Abstract
A technique is developed using patent information available online (at the US Patent and Trademark Office) for the generation of Google Maps. The overlays indicate both the quantity and quality of patents at the city level. This information is relevant for research questions in technology analysis, innovation studies and evolutionary economics, as well as economic geography. The resulting maps can also be relevant for technological innovation policies and R&D management, because the US market can be considered the leading market for patenting and patent competition. In addition to the maps, the routines provide quantitative data about the patents for statistical analysis. The cities on the map are colored according to the results of significance tests. The overlays are explored for the Netherlands as a "national system of innovations," and further elaborated in two cases of emerging technologies: "RNA interference" and "nanotechnology."
AI Key Findings
Get AI-generated insights about this paper's methodology, results, significance, and more — seven facets brought into focus.
Impact
Paper Details
PDF Preview
Key Terms
Citation Network
Current paper (gray), citations (green), references (blue)
Display is limited for performance on very large graphs.
Discussion 0