Marginal and Interactive Feature Screening of Ultra-high Dimensional Feature Spaces with Multivariate Response
Publication
Metrics
AI Quick Summary
This paper introduces GenCorr, a novel feature screening method for ultra-high dimensional data with multivariate responses, which screens both marginal and interactive features. GenCorr demonstrates strong sure screening properties and superior performance compared to existing methods, as shown through empirical simulations and a real data analysis using GWAS data.
Paper Preview
Abstract
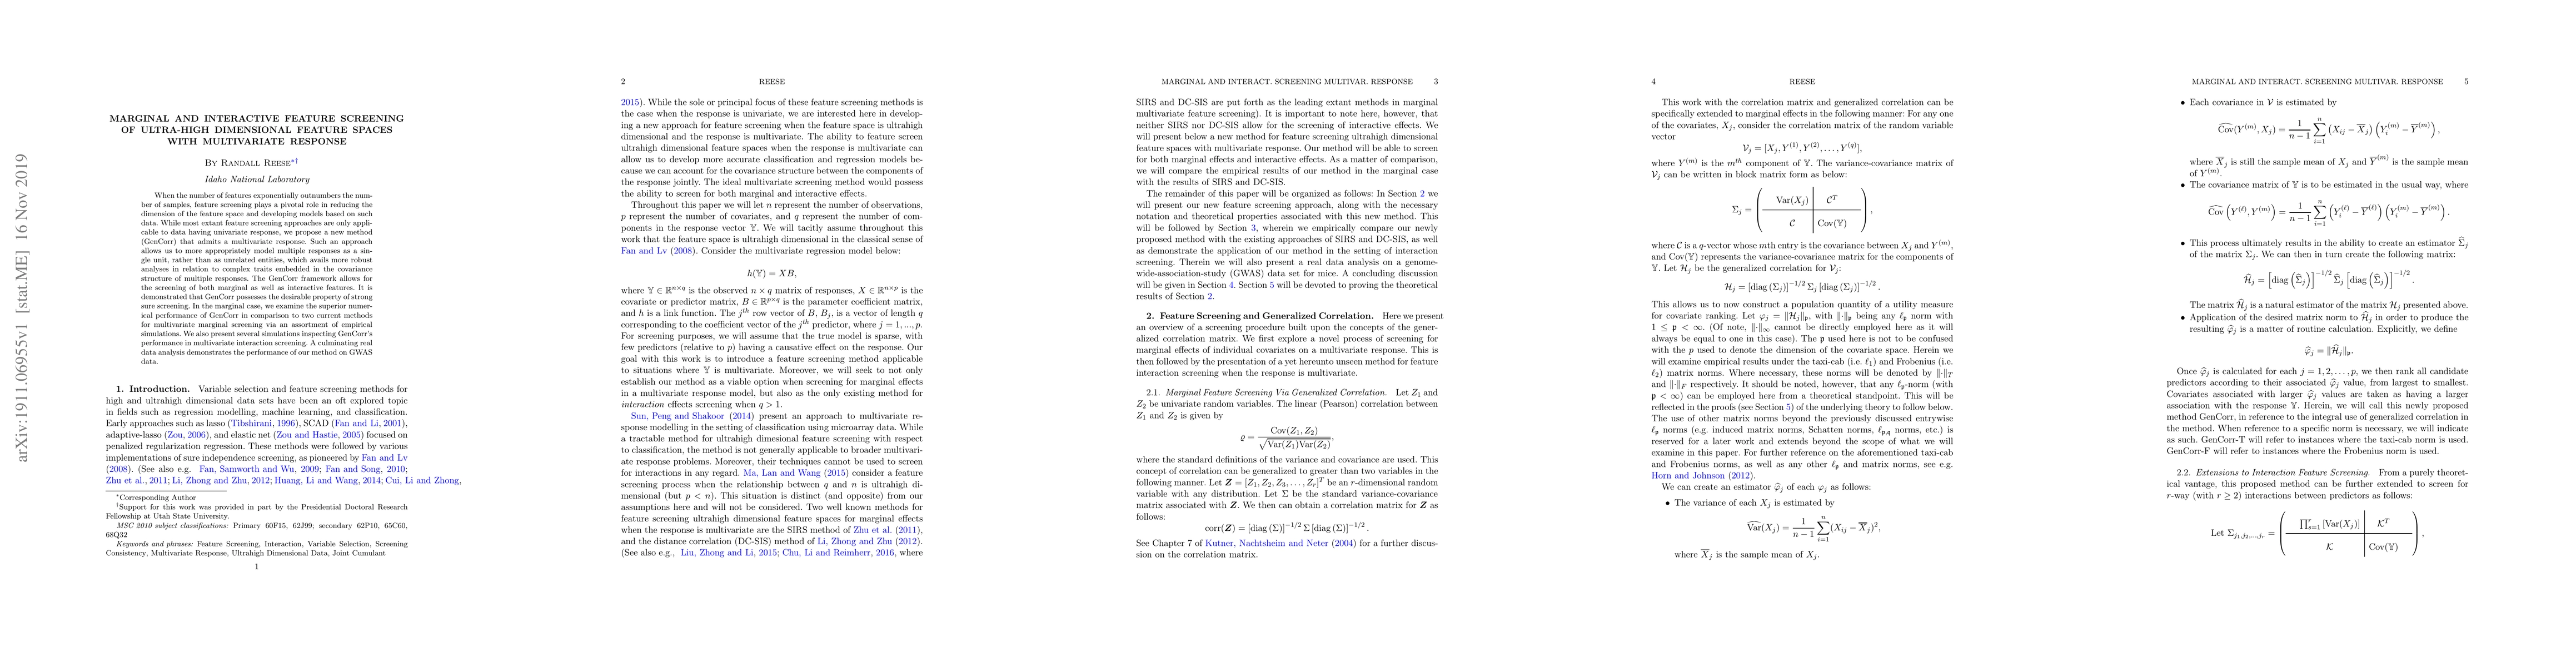
When the number of features exponentially outnumbers the number of samples, feature screening plays a pivotal role in reducing the dimension of the feature space and developing models based on such data. While most extant feature screening approaches are only applicable to data having univariate response, we propose a new method (GenCorr) that admits a multivariate response. Such an approach allows us to more appropriately model multiple responses as a single unit, rather than as unrelated entities, which avails more robust analyses in relation to complex traits embedded in the covariance structure of multiple responses. The GenCorr framework allows for the screening of both marginal as well as interactive features. It is demonstrated that GenCorr possesses the desirable property of strong sure screening. In the marginal case, we examine the superior numerical performance of GenCorr in comparison to two current methods for multivariate marginal screening via an assortment of empirical simulations. We also present several simulations inspecting GenCorr's performance in multivariate interaction screening. A culminating real data analysis demonstrates the performance of our method on GWAS data.
AI Key Findings
Get AI-generated insights about this paper's methodology, results, significance, and more — seven facets brought into focus.
Impact
Paper Details
Authors
PDF Preview
Key Terms
Citation Network
Current paper (gray), citations (green), references (blue)
Display is limited for performance on very large graphs.
Discussion 0