Publication
Metrics
AI Quick Summary
A new model explains financial market structure by analyzing pairwise interactions, revealing a scale-free topology with clustering features and meaningful switches between ordered and disordered states.
Paper Preview
Abstract
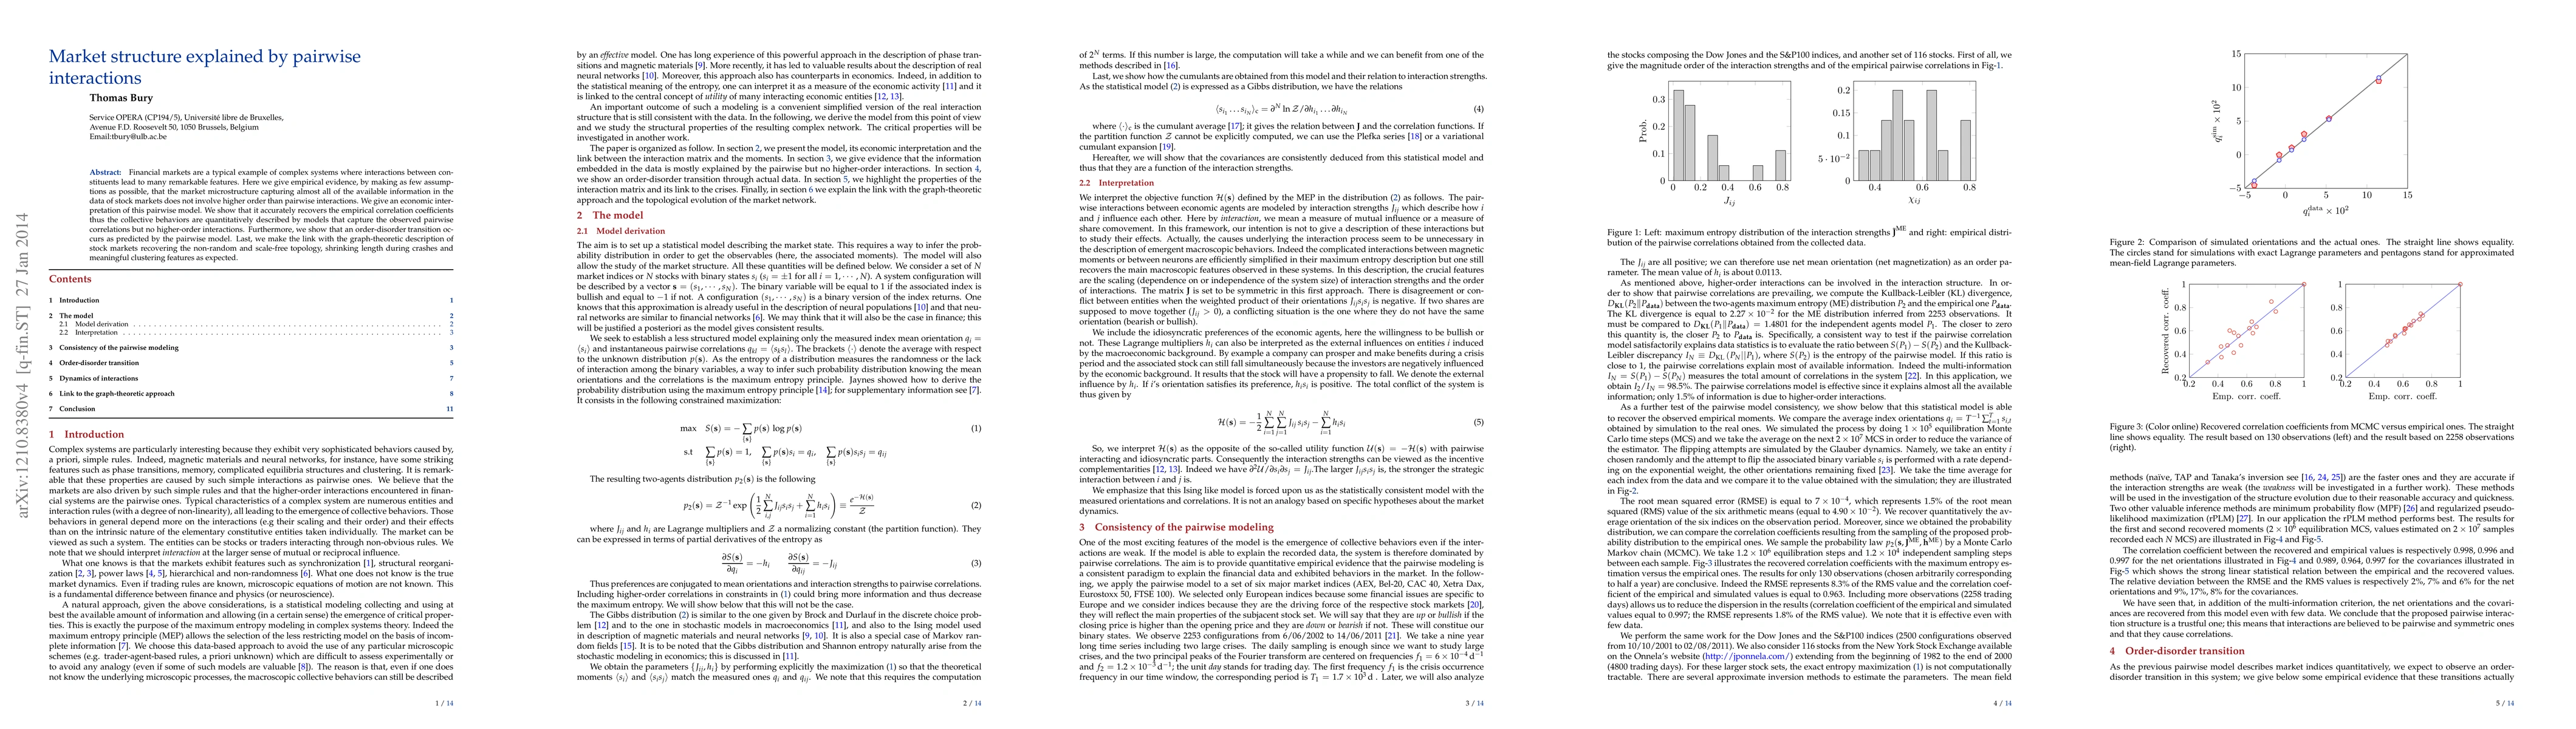
Financial markets are a typical example of complex systems where interactions between constituents lead to many remarkable features. Here, we show that a pairwise maximum entropy model (or auto-logistic model) is able to describe switches between ordered (strongly correlated) and disordered market states. In this framework, the influence matrix may be thought as a dissimilarity measure and we explain how it can be used to study market structure. We make the link with the graph-theoretic description of stock markets reproducing the non-random and scale-free topology, shrinking length during crashes and meaningful clustering features as expected. The pairwise model provides an alternative method to study financial networks which may be useful for characterization of abnormal market states (crises and bubbles), in capital allocation or for the design of regulation rules.
AI Key Findings
Get AI-generated insights about this paper's methodology, results, significance, and more — seven facets brought into focus.
Impact
Paper Details
PDF Preview
Key Terms
Citation Network
Current paper (gray), citations (green), references (blue)
Display is limited for performance on very large graphs.
Discussion 0